The North Sea is ready for its close-up
Plans to build in the North Sea have been proliferating, from another airport to homes on floating islands. It is, of course, key in providing the locations for wind farms, solar power generation and CO2 storage necessary for the energy transition process. But is there room for all these schemes? And will they clash with the activities already taking place on the North Sea? PhD candidate Solange van der Werff and her TU Delft colleagues developed an exceptionally detailed chart providing a comprehensive picture of how busy the North Sea actually is.
Interactive map North Sea
Scroll through the chart and discover for yourself the designated wind farm locations, the main shipping routes, activity around ports and sluices; dredging work locations and ships’ CO2 emission levels.
Detailed visualisation
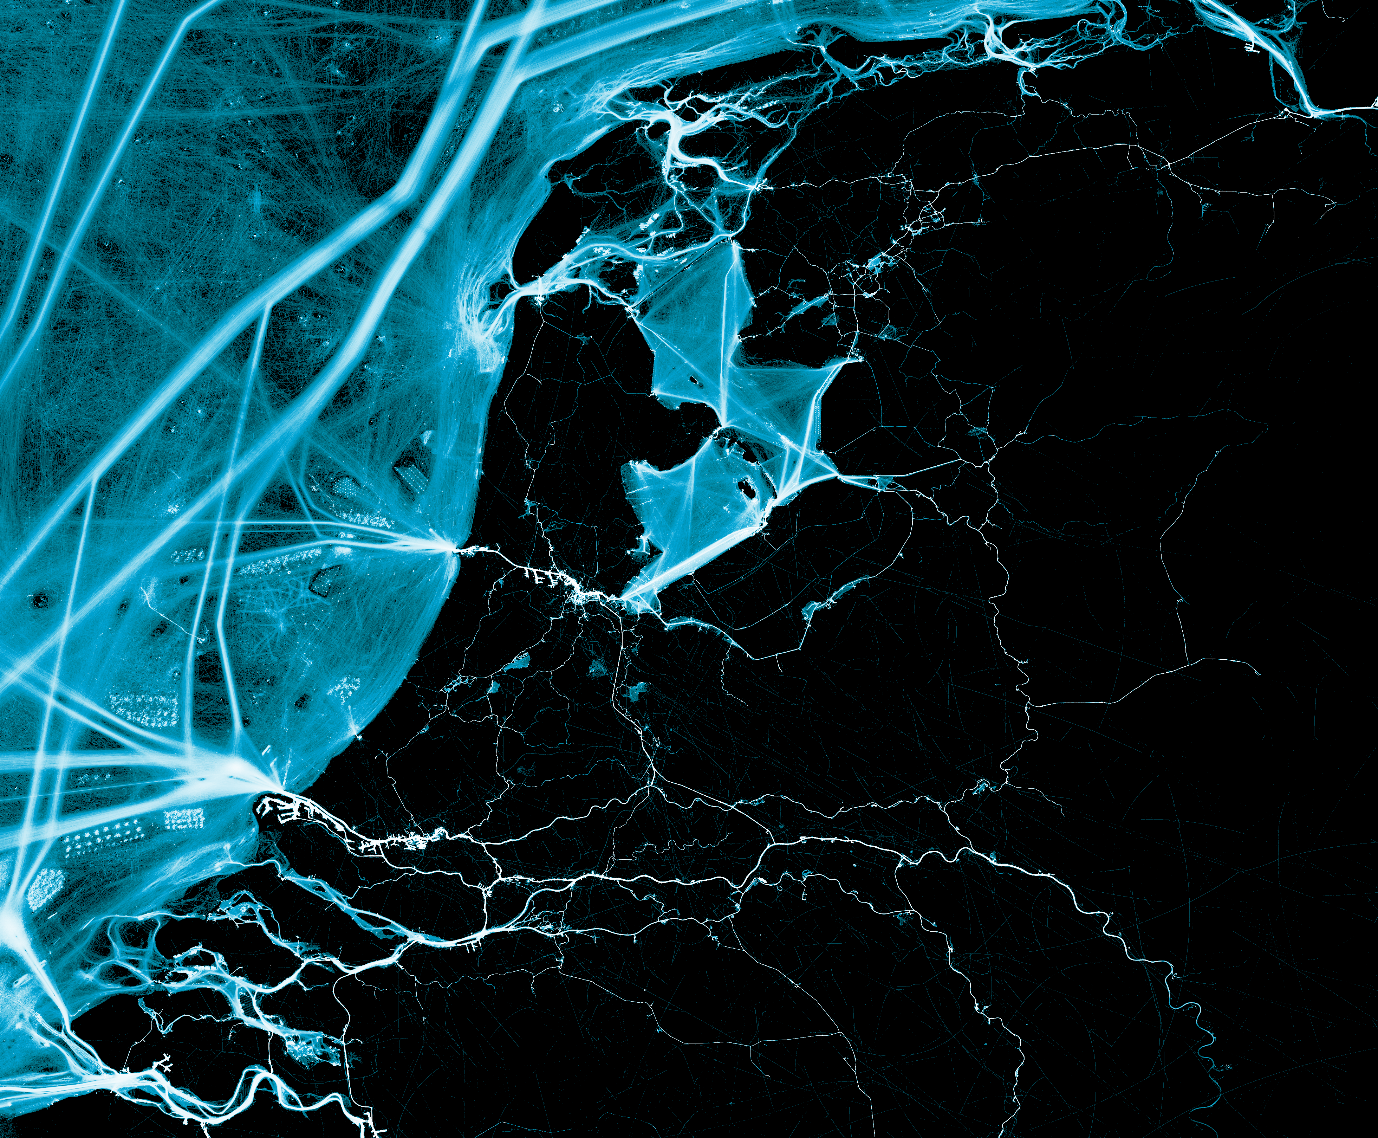
The new visualisation technique has enabled Van der Werff and her team to create a clear image of the level of activity at sea and on rivers and canals. The overall picture shows which parts of the North Sea are already spoken for. Zoom in, and the activities that take place there will appear. The chart’s high resolution makes it possible to distinguish patterns as well as recognise specific nautical activities. ‘The main shipping lanes used to be roughly marked using heat maps. Our chart is so detailed you can even recognise individual wind turbines. We can trace them via the activity of the ships that are doing the work there,’ Van der Werff explains.
Millions of vessel positions
Van der Werff used a dataset of some 4 billion vessel positions to create the chart, collected over a four month period. The data are part of the Automatic Identification System (AIS). Dutch national transport authority Rijkswaterstaat collects this data for the Dutch territory and has made a part of it available to Van der Werff. The system enables skippers, as well as traffic and port services, to read out the position, course and speed of ships in the area, ensuring and improving the safety and smooth running of waterborne traffic.
Larger computing capacity
The huge amount of data acquired through AIS could already be used to create a chart, but computing capacity limited the resolution. One pixel represented an area of several hundred metres. Van der Werff and her colleagues from TU Delft and Deltares are now relying on the Planetary Computer, the new computing facility provided by Microsoft to promote global sustainability. This super computer is able to visualise the AIS dataset with one pixel equalling a couple of metres.
Insight in traffic safety and emission levels
The chart is already a valuable tool to visualise an existing situation. The next step is to simulate changes based on the knowledge that has been gathered. This will help to analyse the routes and speeds of ships, and can also generate new insights into traffic safety and CO2 emissions. ‘This approach will answer the question of whether there is actually room enough on the North Sea to combine the plans that are being made,’ Van der Werff says. ‘So far our partners in the project have welcomed our findings with great enthusiasm.’
Partners
This project, which is supported by Port of Rotterdam and SmartPort; knowledge hub of the Port of Rotterdam, is the PhD research of Solange van der Werff at TU Delft. She is conducting this research within the Department of Ports and Waterways under the supervision of Prof. Mark van Koningsveld. For her research, Van der Werff is working closely with Rijkswaterstaat, Deltares and MARIN.
Rijkswaterstaat shares the AIS data as part of a cooperation agreement with TU Delft. The skippers’ privacy is guaranteed. Data is anonymised and any sensitive information removed.
This is the first instance of Dutch scientists using Microsoft’s Planetary Computer.
