
TU Delft researchers: sea level rise along Dutch coastline accelerating
Sea level rise along the Dutch coastline is accelerating. This is the conclusion of a new study carried out by researchers at TU Delft. A detailed analysis of the measurements at eight tidal stations along the Dutch coastline (including stations located at Maassluis, Delfzijl and Vlissingen) makes it clear that the average sea level rise – since the mid-1990s – has been 2.7 ± 0.4* millimetres per year. In comparison to the 70 proceeding years, this represents a significant increase of 1.0 ± 0.5 mm/year.
This is the first time that a significant acceleration was discovered in the data from tidal stations alongside the North Sea. However, the acceleration measured differs per station. For example, sea level rise is increasing twice as quickly in the Wadden Sea. Riccardo Riva, who in his day-to-day life carries out research into the interaction between the dynamic behaviour of the earth and sea level change, explains this as follows: ‘Measurements of the sea level at a tidal station – when viewed over the entire year – show quite large fluctuations. This is due to various factors such as the influence of wind, atmospheric pressure, and tides. Taking this into consideration, we developed a new method that utilises information about wind, pressure and tides. This enabled us to correct the measurements for “background noise” and to isolate the long-term oceanographic signal.’
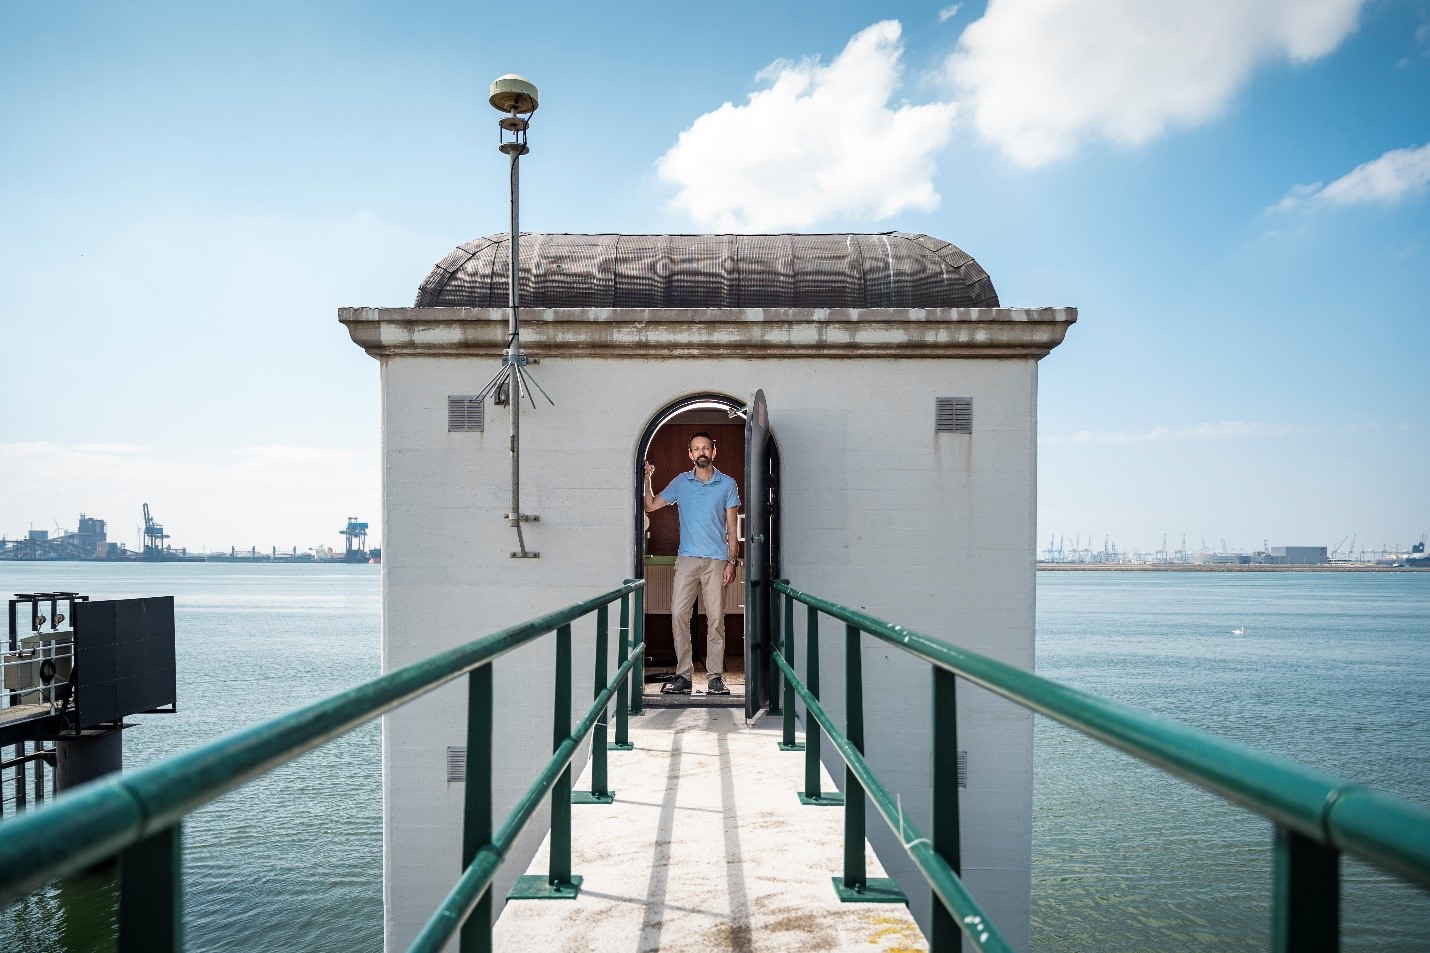
A detailed analysis of the measurements at eight tidal stations along the Dutch coastline makes it clear that the average sea level rise – since the mid-1990s – has been 2.7 ± 0.4* millimetres per year. The findings of Riccardo Riva and colleagues were published in the leading journal Environmental Research Letters. The photo shows Riccardo Riva at the tidal station in Hoek van Holland.

New method
Riva and colleagues applied the method to measurement series of 100 years. At the same time, they showed that it was possible to identify an acceleration in shorter series of at least 40 years if the measurement series continues for 20 years after the acceleration begins. Riva: ‘The acceleration value depends in principle on the length of your analysis period, and is therefore rather arbitrary. That is also why, at a certain moment, we started searching for a “breakpoint”, a sudden change in the behaviour of sea level change. Our search identified 1993 as such a point. In our research, we calculated the trend before as well as after this breakpoint. This demonstrated – for the first time – that the change in the sea level rise acceleration is larger than the (95%) confidence interval of both speeds (before and after the breakpoint). This is an interesting finding, since the period concerned is approximately 30 years. And that is also exactly the minimum length of time on the basis of which climate trends are determined.’
Mystery
The fact that sea level is rising is not new. Sea level has risen by approximately 13 cm over the 20th century. This rise measured can be explained in large part by the loss of mass from Greenland and glaciers in polar regions and the thermal expansion of the oceans. The latter is caused by the fact that the upper layer of water expands due to the increase in air temperature. As a result, the distance between the molecules of water increases. ‘However’, explains researcher Riva, ‘an average global sea level rise does not, in itself, say all that much about the increase along our coastline. People tend to think that everything moves together, but a large part of the changes along the coast are caused by ocean currents. And what happens elsewhere in the ocean does not always have an effect on our small part of the North Sea. In principle, all kinds of things can take place here. So the question that intrigued us the most was: What do we actually see happening along the Dutch coastline?’
Eight tidal stations
To answer this question, Riva and colleagues started – at the end of 2019 – to study the measurement data from eight different tidal stations: at Vlissingen, Maassluis, Hoek van Holland, IJmuiden, Den Helder, Harlingen, Delfzijl and Cuxhaven (Germany). So why was Riva’s research group the first one in the world to adopt this approach? Riva: ‘Our research community is not very big. In addition, nowhere else in the world can you find such a good set of data. You have to realise that all eight tidal stations are more than 100 years old. And nowhere else in the world can you find so many stations at such a short distance from each other, together with an uninterrupted series of measurements, without any holes, over the last 100 years. That is simply not available elsewhere in the world.’
Cause for concern
Until now, it was not clear whether the sea level along our coastline is actually rising more quickly than in the previous century. Riva and colleagues have put an end to this uncertainty. Should we now be concerned? ‘That is more a question for politicians’, says Riva. ‘However, I would advise other low-lying areas in the world to purchase measuring equipment as soon as possible and to carry out long-term measurements. After all, accurate information about the rate of our sea level rise is of crucial importance. It is crucial for the short term, for example with regard to the sand suppletion activities along the Dutch coastline, supplying extra sand to the beach or see bottom, as well as for the long term, whereby we have to take appropriate measures to protect our coastal areas against the effects of sea level rise.’
*) All uncertainties are calculated on the basis of 95% confidence intervals
More information
If you have any questions about the acceleration of the sea level rise along the Dutch coastline or the acceleration of the energy transition, please feel free to contact:
- Dave Boomkens, media relations officer for the Energy transition TU Delft – D.J.Boomkens@tudelft.nl / 06 34 08 14 61
- Dr. Riccardo Riva, associate professor at the faculty of Civil Engineering and Geosciences – R.E.M.Riva@tudelft.nl
Via this story you can read more about Riccardo Riva, who carries out research into the effects of moving water masses from one place to another.
And here you can read about the research based on an analysis of the measurements at eight tidal stations, which was just published in the leading journal Environmental Research Letters.