The trajectory calculations for satellite missions must be as accurate as possible – an area in which Dr Ernst Schrama and his colleagues have been experts for decades. They also use satellite data to monitor changes on the surface of the earth. And with new missions with cutting-edge measuring equipment soon to be launched, the challenges keep on coming. “No time to sit twiddling your thumbs in this line of work,” says Dr Schrama.
Dr Ernst Schrama has been a member of the Astrodynamics and Space Missions research group of the Space Engineering department for more than 15 years. At the time, they started out calculating satellite trajectories with extreme precision. “Traditionally, our research group has been focussed on satellite trajectory mechanics. Using laser, radar and radio frequency measurements taken from the ground, we can determine a satellite’s exact location and calculate where it is headed,” explains Dr Schrama. Due to their considerable expertise, Dr Schrama and his colleagues have been involved in a number of missions, including the European Space Agency’s GOCE mission in 2009, the CryoSat-2 mission in 2010, and the SWARM mission in 2013.
But that is not all. They are also experts in producing and interpreting detailed models of measurement data transmitted from the instruments on board the satellites. One significant application of this data is monitoring changes on the earth’s surface for conducting geophysical research, including changes in ice caps and sea levels. “Geophysicists observe the earth system and the changes it undergoes,” clarifies Dr Schrama. “The idea is that, without touching the earth's surface, we know its volume and shape and how it is changing. This we can do achieve both directly, using altimetry, and indirectly using measurements of the planet’s gravitational field.”
Radar altimeter measurements
Altimeters borne in satellites have delivered new insights into exactly what the oceans look like beneath the surface and how the sea floor has changed over the course of millions of years. Dr Schrama presents a map composed entirely of radar altimeter measurements and points out what looks like a chain of undersea volcanoes: the Hawaii-Emperor seamount chain. “That volcanic system formed above a hot spot deep in the earth – a sort of stove pipe, if you will. A number of volcanic islands currently lie in that area and more are still appearing. But the earth’s crust – the Pacific Plate to be precise – is moving extremely slowly, by a few centimetres a year, towards the north-west. So, where Hawaii now lies, the ocean floor is slowing moving in a nor’westerly direction while to the south-east, new islands are being formed. This process has been in motion for 300 million years and we can clearly recognise it on the gravity map.”
Ice masses and oceans, mountains and continents make the surface of the earth irregular and, what is more, they are still moving. This in turn creates changes in the planet’s mass and therefore also in the gravitational field, depending on where and when you measure. Humans are unable to feel these gravitational variations, but we can observe them with satellites. Gravitational measurements can therefore also provide information on sea currents and glacier movements, for example. And in these cases, two satellites are better than one. “We have collaborated on developing experiments in which multiple satellites are sent into space,” relates Dr Schrama. “We are then able to measure the mutual distance between the satellites and how this is influenced by the gravitational field acting upon them, which in turn enables us to better investigate the field itself. A good example of this is NASA’s GRACE mission which was launched in 2002. Over the past 15 years, the twin satellites have provided new insights into the proportions of land and water around the globe.
Rising sea levels
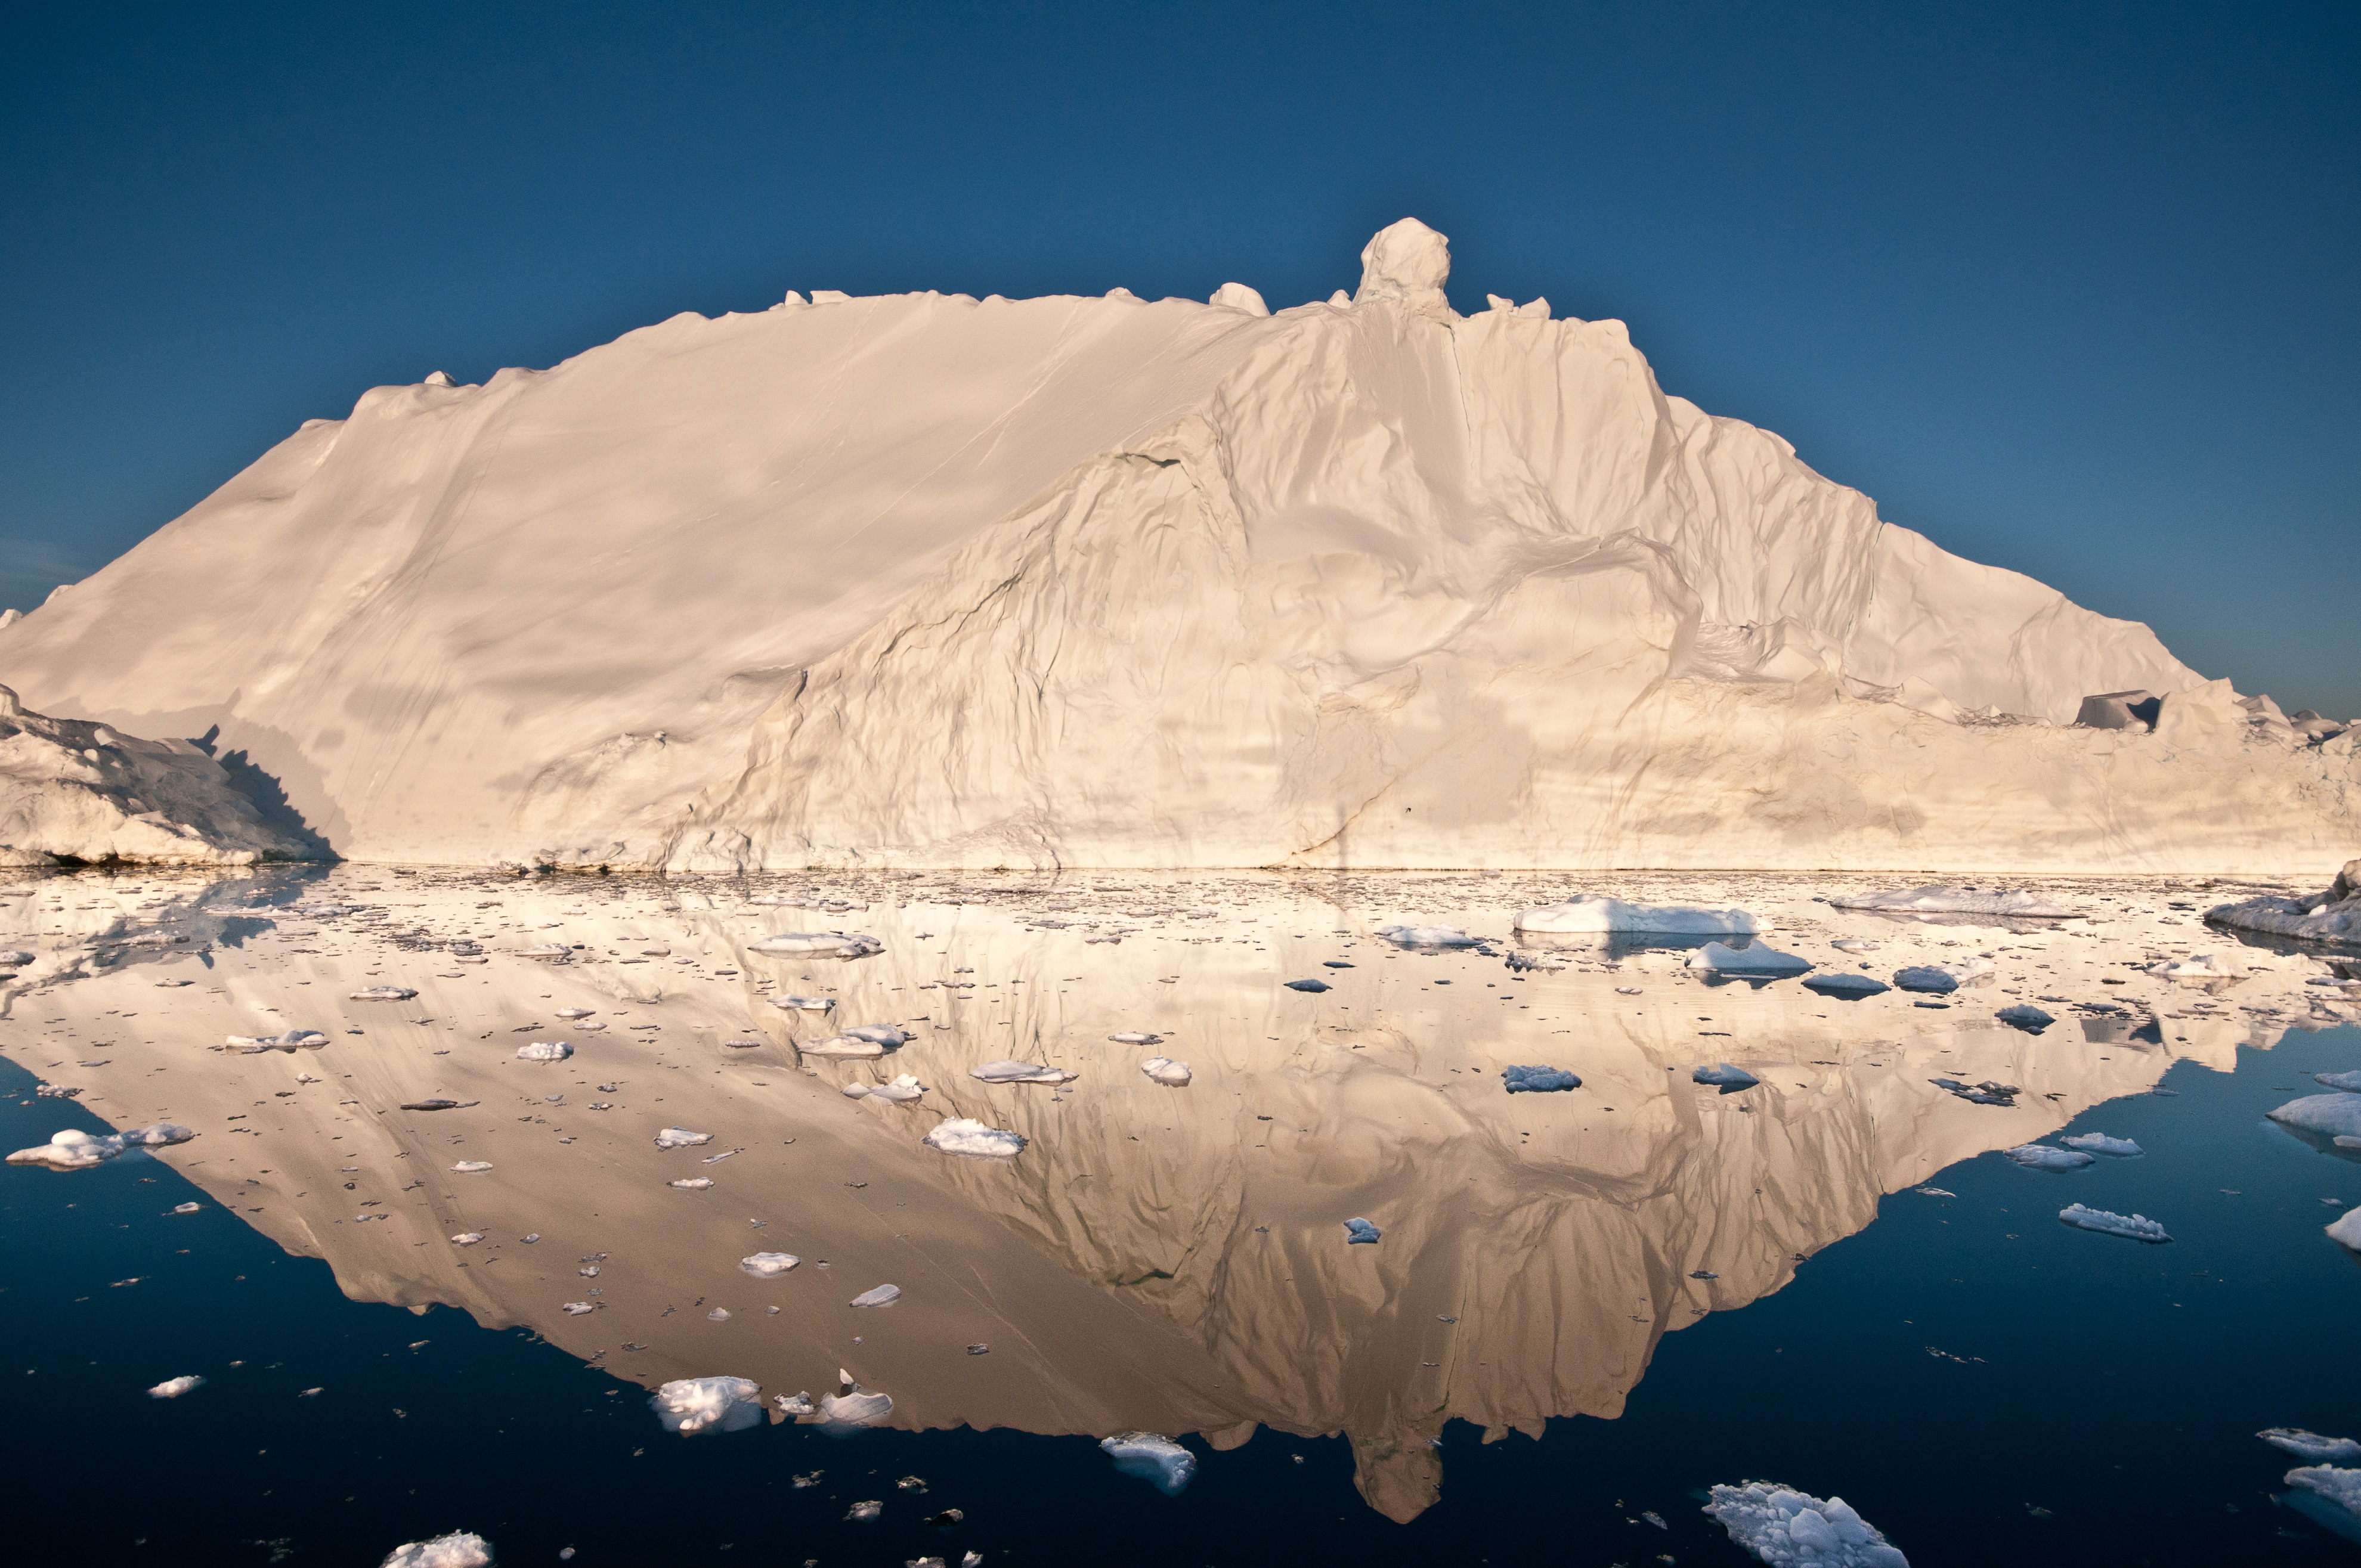
The most important changes being observed are those in ice masses and sea levels due to their connection with climate change. Based on historical sources, we know that the current increase in sea levels is demonstrably greater than any in the past 2000 years. “The Romans built reservoirs that they used to catch fish which had an opening at the same height as the tidemark. This tells us the height of the water line 2000 years ago, which is approximately 60cm below the current sea level,” explains Dr Schrama. “This provides an indication that the sea level has risen by around the same amount over that period. We are now measuring rises of 30cm per hundred years – that is 60cm every two centuries instead of every two millennia. We also know that the ice systems are decreasing in size,” he continues. “But the question is: is the current rise in sea levels being caused solely by melting ice or are other factors at work, for example the oceans warming and consequently expanding?”
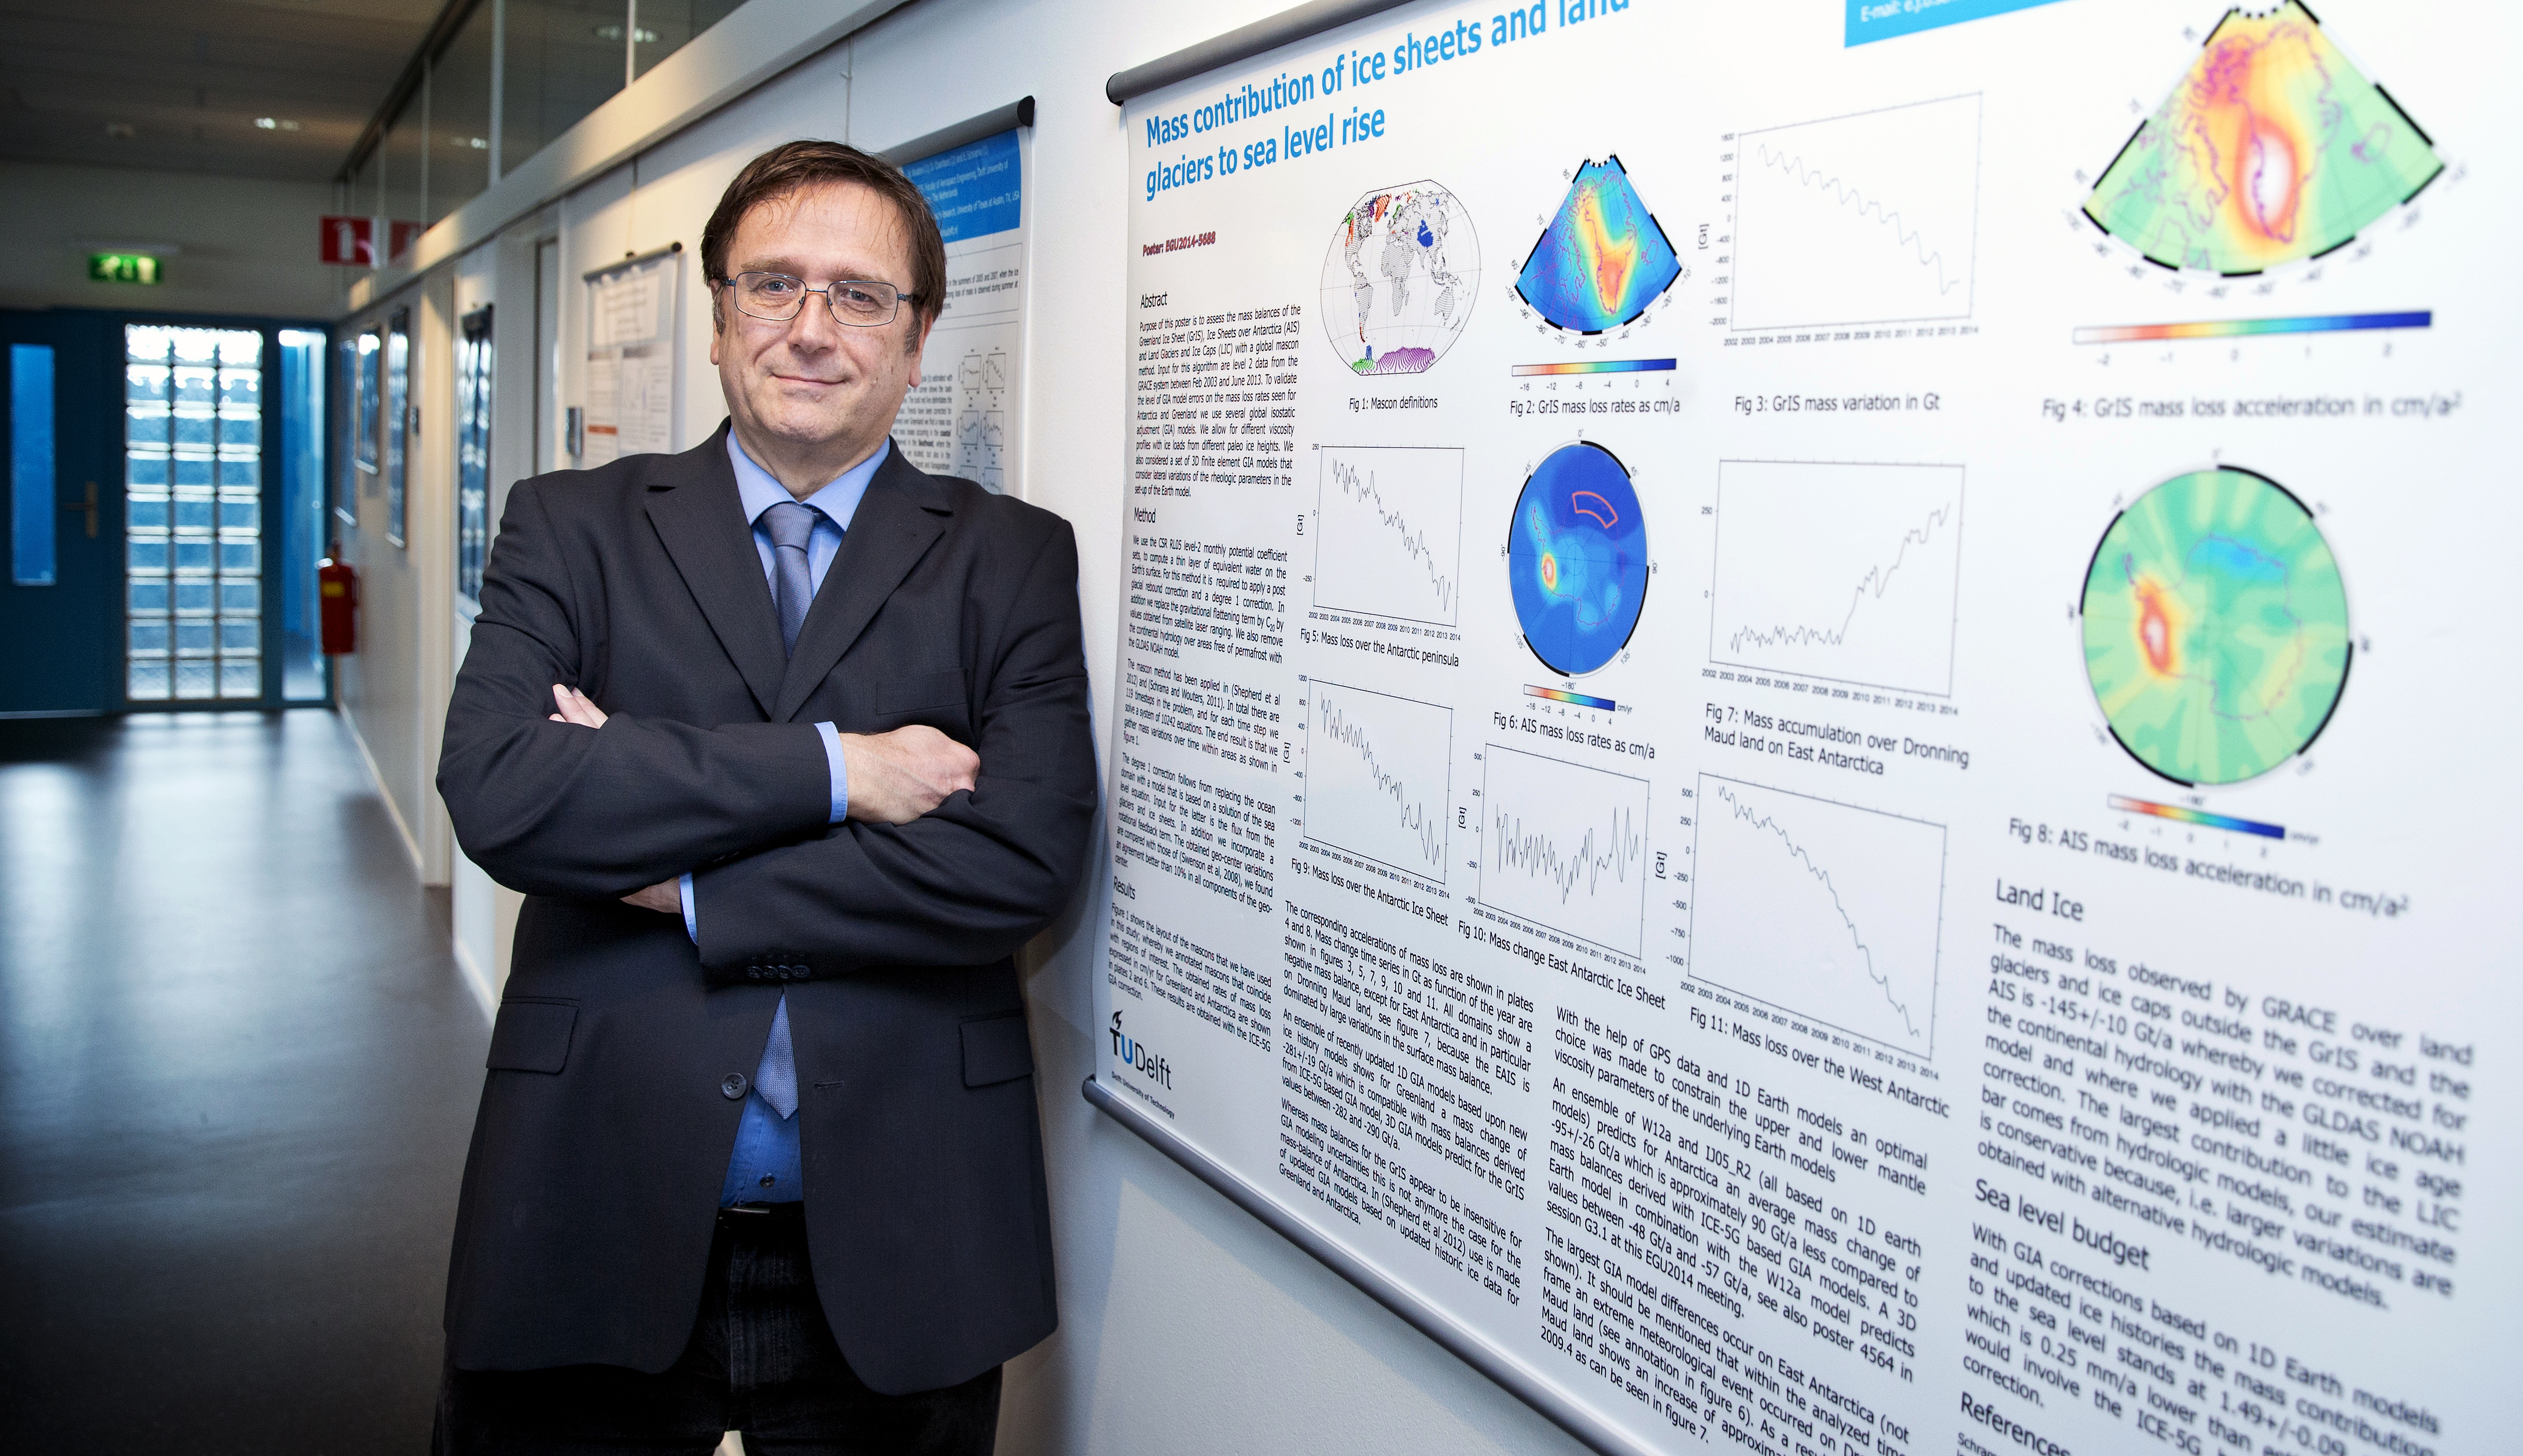
Dr Schrama’s research reveals that half of the rise can be attributed to the thermal expansion of the oceans and the other half to meltwater from glaciers in Greenland, Antarctica and smaller ice systems such as Alaska and the Alps. To arrive at these results, he combined a range of different types of measurements. “Altimeter measurements taken above the ice and gravity measurements demonstrate what is happening to the ice, and we also measure fluctuations in the volume of the oceans. Subtracting the one from the other tells us what proportion of the increase in sea levels can be ascribed to which phenomenon.” He has also combined satellite measurements with other techniques. “There is a whole network of automatic buoys in place that measure, for example, the temperature and salinity of the oceans. We then check whether this data concurs with our calculations based on laser and radar measurements.”
Post-glacial rebound
Another factor to account for in order to effectively model current changes in the ice caps and sea levels is post-glacial rebound. The earth’s crust is still rebounding upwards following the melting of the ice caps when the last major glacial period came to an end 20,000 years ago. “The Scandinavian and North-American ice systems have now disappeared, but that rebound process is not yet complete and we are able to measure it very accurately,” says Dr Schrama. “It is considerably more difficult in the case of Antarctica, however, since that system is significantly larger. Modelling that process is another thing we do here. To this end, we combine measurement data from the GRACE satellites with, for example, GPS measurements from receivers on the ground and data relating to ocean bottom pressure.”
Furthermore, a topic such as climate change continually raises new questions. “Over the past 15 years, we have observed transformation processes in progress. Are these processes accelerating, and if so, what is the underlying cause, or will it change again in another ten years? That is what we want to be able to measure and understand, and in order to do so we need to launch further satellite missions and conduct measurements with new instruments.” These missions are also in the offing. “Work is currently under way on a follow-on GRACE mission, which will be launched shortly. The current mission uses microwaves to measure the mutual distance between the two satellites, but a laser interferometer will soon supplement the microwave technology which is expected to be 20 times more accurate. Better instruments and faster data speeds also entail new challenges. How do we put this information to use? Will the new measurements correspond to the previous ones or will we need to make corrections? Do they actually deliver better quality information?”
New missions and fresh challenges
Another mission in the pipeline is NASA’s ICESat-2 (Ice, Cloud, and land Elevation Satellite 2). “ICESat-1 did not survive overly long: from 2003 to 2009. There was a problem with the lasers which meant that measurements could not be taken continually. The new mission promises to improve on this score,” says Dr Schrama. “Of course, this is in addition to ongoing missions, so that is quite a lot of measurement instruments all transmitting data for us to process. No time to sit twiddling your thumbs in this line of work.” In the meantime, all of the existing missions and instruments have produced a ton of data and in order to keep track of it all, the research group also manages RADS (a Radar Altimeter Data System). “We are getting more and more RADS users and are doing our best to make the system as accessible as possible.”
Teaching
Dr Schrama has no time for thumb-twiddling on the teaching side either. “We now have an intake of more than a hundred Master's students each year; ten years ago it was only 40 or so. And the traditional image of a cohort made up of students primarily from the Netherlands and Belgium is now well out of date. For example, we are seeing large numbers of students from Southern Europe and a great many exchange students from the Erasmus programme.” Students these days also stipulate different requirements. “Conducting teaching online is a change that we really must progress,” says Dr Schrama, who has now put together an online version of the Satellite Orbit Determination course.
Another tradition within the Space Engineering department is building and launching (small) satellites – the CubeSats – which Dr Schrama also uses for his laboratory lessons. “We allow the EEMCS students to take the measurements themselves so they can see what the signal at a ground control station looks like and subsequently use it in their calculations.” The department is also busy developing the even smaller PocketQubes and Schrama is enjoying helping plan experiments with them. “This could result in useful information for us, for example concerning space weather conditions.” The research in this regard began some time ago. “One of my former professors once lobbied the ESA hard to install a gradiometer in the GOCE satellite. The design studies for the gravimeter were completed here in Delft in the 1980s, addressing questions like ‘what do we need to measure’ and ‘what sort of results are we expecting to obtain?’” Dr Schrama relates. “You then have to leave it to the industrial sector to determine how to go about building such an instrument.” In this instance, Dr Schrama entrusted the task to the hands of his colleagues.