
The role of, and impact on, mobility on the course of the virus
Oded Cats and Serge Hoogendoorn
With contributions by Panchamy Krishnakumari and Hans van Lint
The COVID-19 pandemic has a profound effect on travel worldwide. The effects range from a dramatic decrease in air travel to an unprecedented share of the workforce who are teleworking. This is caused by both governmental measures such as travel restrictions and the closing-down of whole sectors of the economy), and travellers’ choices to refrain from travelling in order to reduce their exposure to other people and thereby the risk of contamination.
The impact of the virus spreading (and related measures) on mobility
Thus, the virus has a dramatic impact on travel patterns in terms of number of trips and distances travelled, purpose of travel, and choice of travel mode. We see a decrease in the use of cars and public transport, with fewer people per vehicle, as well as an increase in walking and cycling, including more recreational trips. Other changes in activity patterns include more online shopping. With the help of travel data we can analyse and compare the impact of the various measures on mobility.
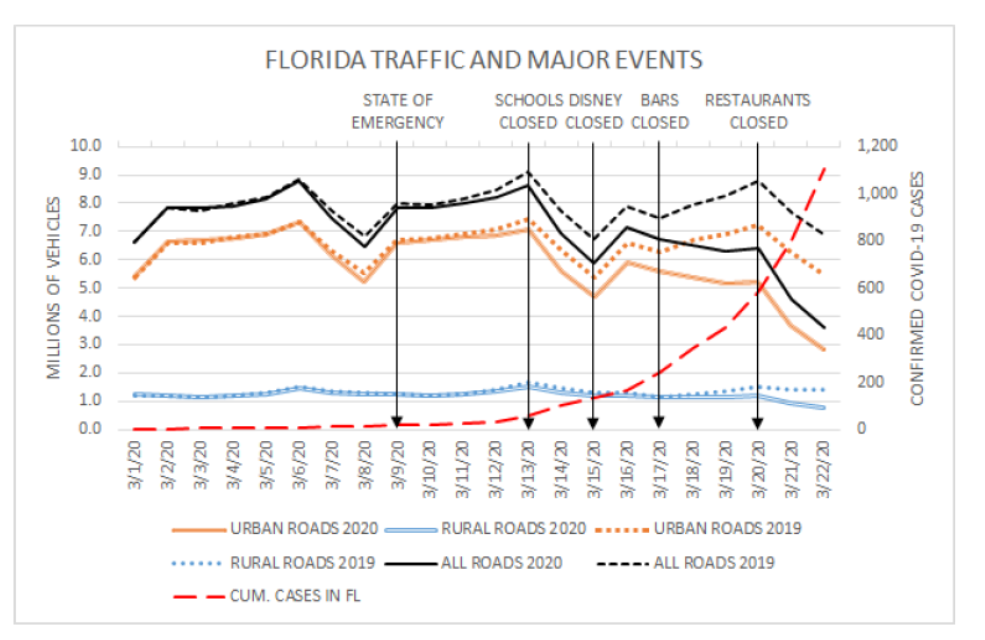
Several research groups worldwide are monitoring mobility trends during the course of the corona crisis.The figure above is part of an international comparison we are making on the impact of the various measures on mobility. For a complete overview of such trends it is necessary to combine data sources that cover various travel modes and include counts, trajectories and travel diaries. Surveys can complement such data with insights in users’ perceptions and intentions. It is important to note that since the conditions are very dynamic and abnormal, travel patterns change rapidly in response to public perceptions and restrictions. For example, data from the National Data Warehouse for Traffic Information (Dutch: Nationale Databank Wegverkeersgegevens, or NDW) show a shift in movements in time and space, but not necessarily in the amount of trips that people have been making. Similarly, pedestrian data show more activity in parks on the weekends, but in general far less people on the streets. Densities are far lower.
We expect the coronacrisis to have long-lasting effects on mobility and logistics (i.e. distribution), among others due to changes in traveller preferences and changing activity patterns. Preliminary results suggest that people will work from home more often, will make less use of public transport and will cycle and walk more. Another likely change is an increased car use, also due to dropping petrol prices. We thus expect a shift to more individual modes of transport: risk of perceptions surrounding public transport and public health amounting to a ‘PT-shame’ effect, and possibly less interest in shared mobility (MaaS, car sharing, ride splitting, carpooling). At the same time, there may be opportunities for ride-hailing systems, in particular the non-sharing variant, to increase their market share as an alternative for conventional public transport. Another interesting aspect is whether we will see more online shopping, both utility and hedonic shopping. What will happen to the Dutch preference for physical grocery shopping instead of on-line? The Netherlands is really trailing behind here, and even during the crisis it seems that people do not or cannot do on-line grocery shopping. Finally, the financial viability of some transport providers, most notably airlines, mass transit providers and shared mobility services, might be at risk. Public transport is a critical social infrastructure and as such governmental support is expected.
Impact of mobility on the spreading of the virus
As clearly and painfully demonstrated in this global crisis, connectivity is not only an asset and a means of exchange of ideas and goods, but also a potential catalyst of adversity such as viruses. As is often the case, there is an inherent conflict between efficiency and robustness. The epidemic became a pandemic partially because of hypermobility - in particular through air travel. Passenger transport where people share the same facilities and vehicles with fellow travellers with diverse origins and destinations is especially prone to virus spreading.
Two recent studies gave insights concerning potential virus spreading in mass transit networks and in ride-sharing services. Both studies highlight the public health risks associated with the operations of passenger transport, as well as stressing the importance of the incubation periods and confining the number of fellow travellers one is exposed to in both time and space.
Mass transit networks
In a period where sharing and crowding are becoming a public health concern, the connectivity and efficiency offered by mass transport become a potential peril. It is important to realize that crowding in public transport has two negative effects for virus spreading that exacerbate each other: increasing likelihood to be exposed to infected co-passengers as well as increasing proximity to fellow travellers and the resulting transmission probability. Smart card data allows us to reconstruct the network of passengers that travellers potentially get in contact with during the course of their public transport journey. We can also use these data to assess and assign probabilities of getting infected from connections in the contact graph based on crowding estimates.
Krishnakumari and Cats (2020) study how the virus may spread in a mass transit system. They apply an epidemiological model to the case of the Washington DC metro system. They use smart card data to construct contact networks. The contact network for the Washington DC metro network reflects for each passenger how many other passengers they potentially experience in proximity on a given working day, i.e. a person is connected to another person if they have been at the same station/train at the same time. Based on this definition, the average passenger in the DC metro has ~1200 person-to-person interactions. However, this number varies greatly among passengers, with some of the passengers being super-connectors that have a particularly high potential to spread the virus as they come in contact with many fellow passengers. Based on the smart card trajectories, the researchers then calculate the crowding conditions that each passenger is experiencing on any segment of the journey, as well as the probability that a person is standing next to someone who is infected, based on the trajectories of those assumed initially infected. Each passenger on any given day is in one of the following states: susceptible (not infected), infected (and travelling), quarantined (infected and not travelling), and immune (and travelling again).
Study results show that even when merely 3 passengers are infected to start with, 55% of the passengers’ population is infected within 20 days (Figure 2 below). The impact of an initial rate of 3000 passengers (about 1 in 100 passengers) as opposed to an initial rate which is 3 orders of magnitude smaller (3 passengers imply about 1 in 10,000 passengers), is only a 5% difference in infection rate. This stems from the long incubation period and the connectivity of the contact graph resulting from network topology and demand patterns.

This chilling finding indicates how things could have gone if severe stay-at-home measures such as those imposed in most countries were not instantly implemented, or how they may still go wrong in the event of an irresponsible exit strategy. The insights gained in this study can aid in preparing exit strategies and transitioning to a 1.5 meter society. The model can be applied to assess intervention scenarios such as limiting the ridership for certain segments or the impact of closing certain stations. Furthermore, it demonstrates how smartcard data can be used for contact tracing and the model allows investigating how self-quarantine based on contact tracing information (as opposed to the incubation period) can impact the spread of the virus.
Ride-sharing networks
In the urban context, ride-sharing services offer an alternative that while it does not nullify the exposure, it may be dramatically reduced while remaining affordable. Kucharski and Cats (2020) examine how ride-sharing services contribute to exacerbating the epidemic. On one hand travellers are exposed to co-riders that might be infected. On the other hand, the limited number of co-riders you may be exposed to, also known as contact network, may impede the spreading. They assume that initially infected travellers infect others before they quarantine, and that demand may vary from one day to the other. Consequently, passengers may be matched with different fellow passengers on any given day. Once infected passengers are quarantined, they are not sharing anymore and new matching patterns emerge among the remaining travellers, who may infect further.
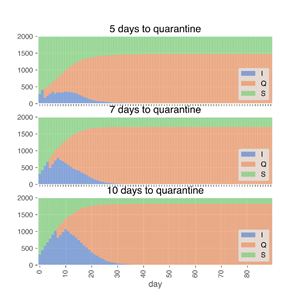
Applying an epidemiological model to examine ride-sharing patterns in Amsterdam, they found that the virus easily spread through a highly connected giant component and infect a large share of the travellers. Nevertheless, we observe spatiotemporal limits of virus spreading in ride-sharing. They used these findings to demonstrate how spread processes may be limited. The incubation period – the period between getting infected and the diagnosis followed by quarantine – is a key determinant of the virus spreading. Figure 3 below shows how the number of passengers in each category – Susceptible, Infected, Quarantined – evolves for different number of days to quarantine. Reducing the incubation period is of prime importance not only for mitigating the distribution of the virus to fellow travellers, but also for flattening the curve and thereby reducing the pressure on medical facilities.
The results of this study show the importance of confining the size of the contact network generated by ride-sharing. This has profound implications for service operations. Service providers are therefore advised to:
- stimulate riders to the extent possible be consistent in the time periods and service areas for which they use the service
- strive to match passengers as much as possible with co-riders that do not much extend their contact graph (e.g. instead of matching two people that have never shared a ride before, better match two that have in the past been exposed to roughly the same people)
- similarly, also routinely assign wherever possible the same pool of drivers to the same pool of travellers. These measures will benefit public health, albeit admittedly at the cost of increasing operational costs and reducing the level of service.
Dr. Oded Cats
Oded Cats is specialized in Passenger transport systems. His main research aim is to develop network, operations and behavioural models for multi-modal passenger transport systems. Together with colleagues, he develops empirical knowledge and tools to support the role of public transport in the 1.5m society.
Meer informatie:
Smart Public Transport Lab
Openbaar vervoer en deelmobiliteit in en na de coronacrisis

Prof.dr.ir. S.P. (Serge) Hoogendoorn
Serge Hoogendoorn specialises in traffic management. He focuses on observing, understanding and modelling traffic flows in networks. His main interest lies in the control principles needed to do this in the best possible way. Hoogendoorn and his colleagues are now using their knowledge and experience in this field to shape our mobility within the 1.5 metre society.
More information

Dr. Panchamy Krishnakumari
Panchamy Krishnakumari is specialized in traffic data analysis. Her research focuses on pattern recognition of large-scale metropolitan networks. Together with colleagues, she combines the field of complex networks, epidemic modeling and data to study some of the challenges faced by public transport amid the coronavirus pandemic.
