Case 18: Open-access zone
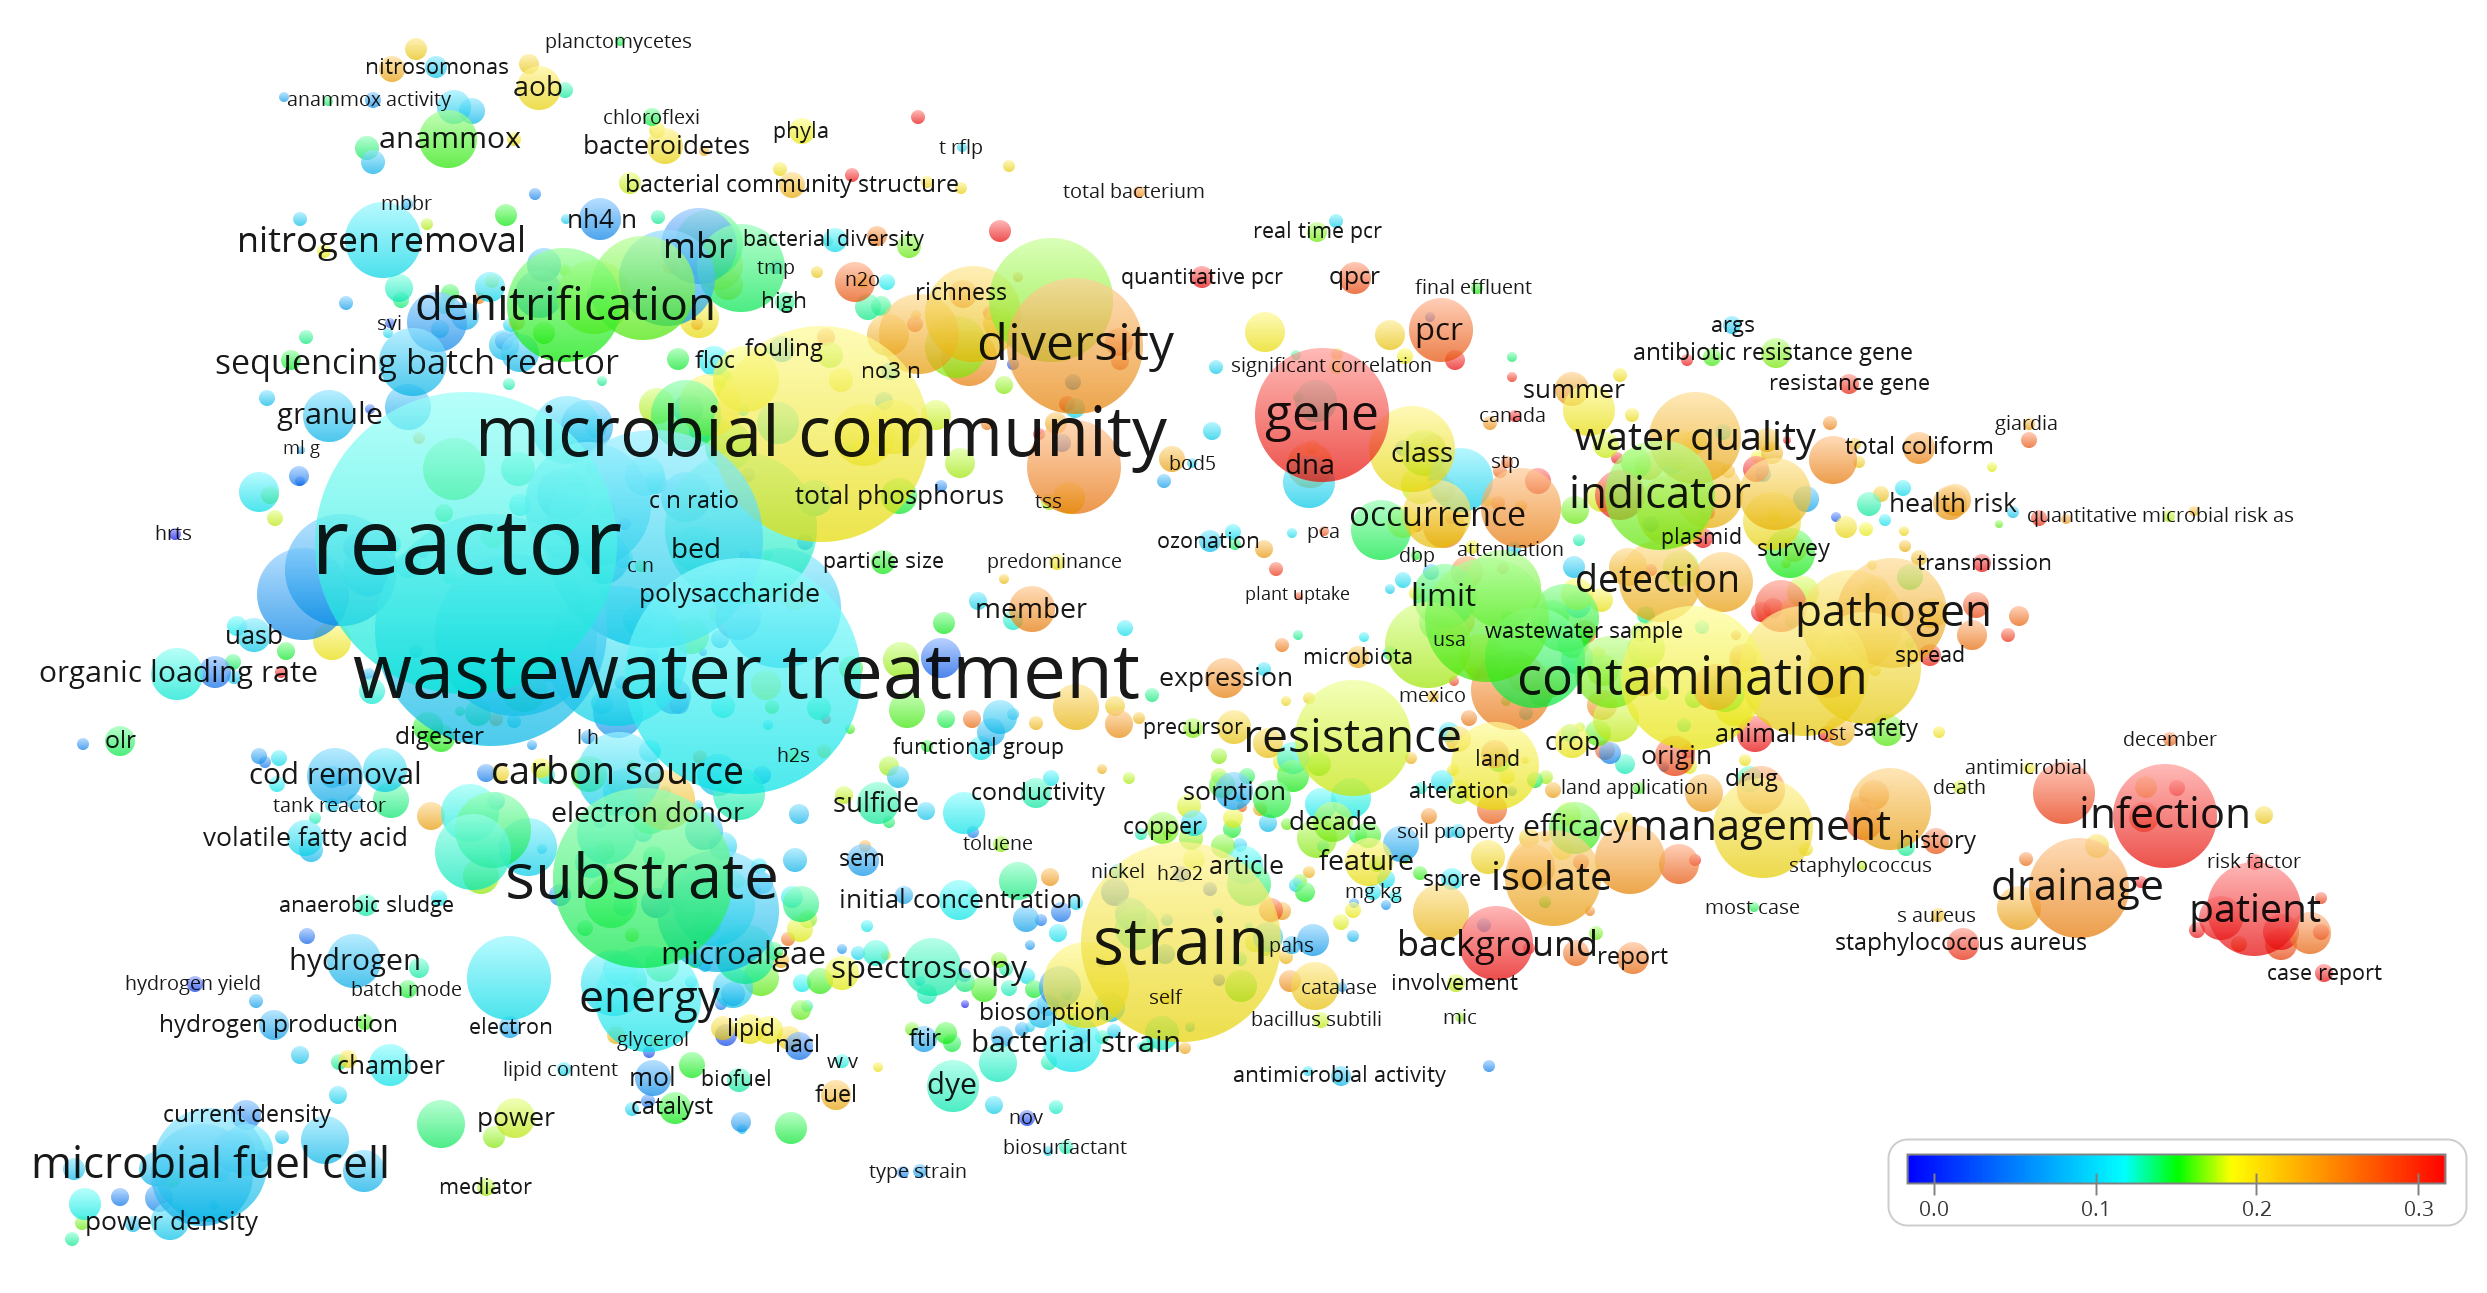
This term map shows the state of the art in research on Microbiology, based on a search in Scopus search engine. The overlay color of each circle corresponds to the fraction of papers that include the corresponding term and are open-access. Data for this case study is provided by Jorden Esser and Dirk-Jan Ligtenbelt.
What
gives an overview of a research area and shows the amount of papers published in form of open-access papers (based on green, blue, yellow, white or gold licenses)
Why
to know how different research communities within a research area are publishing in open-access form
Who
policy makers
How
1. collect your data from an appropriate data source
2. use the OADOI api service to extract the open access status of each article (the OADOI api needs the DOI of articles).
3. generate corpus and score files such that the corpus file includes the title and abstract of each article and the score file includes the open-access status of the corresponding articles
4. use the overlay visualization feature to color the terms based on the open-access status
5. use the VOSviewer screenshot to export your map
oaDOI API Access