Case 7: Conference submission profile
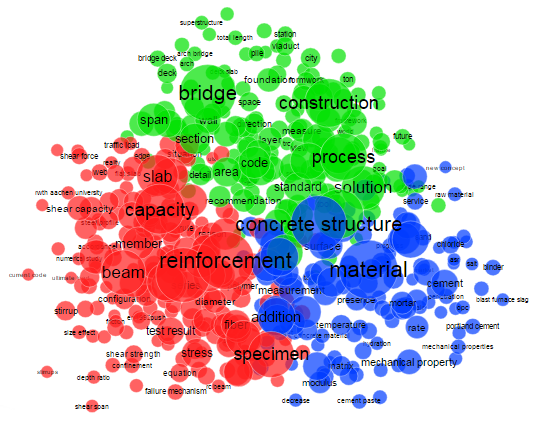
This term map visualizes the terms that appear in title and abstracts of articles submitted to a conference. The large circles indicate which terms are mentioned more frequently. The terms that are closer to each other and have the same color, that are automatically determined by the software, indicate the terms that co-occur very frequently. Data for this case study is provided by Mladena Lukovic, Dr.
What
provides an overview of the submitted articles (abstracts) to a conference or journal
Why
to allow conference participants navigate through the terms mentioned in the submitted papers, and be able trace the terms back to the submitted articles
Who
group leaders and policy makers
How
1. collect the data (authors, title and abstract) of articles submitted to the conference
2. import the data into VOSviewer
3. generate the term map based on text data
4. use the VOSviewer screenshot to export your map
5. you can use the AIDA web-interface to show the results on your website