Case 8: Consortium assembly profile
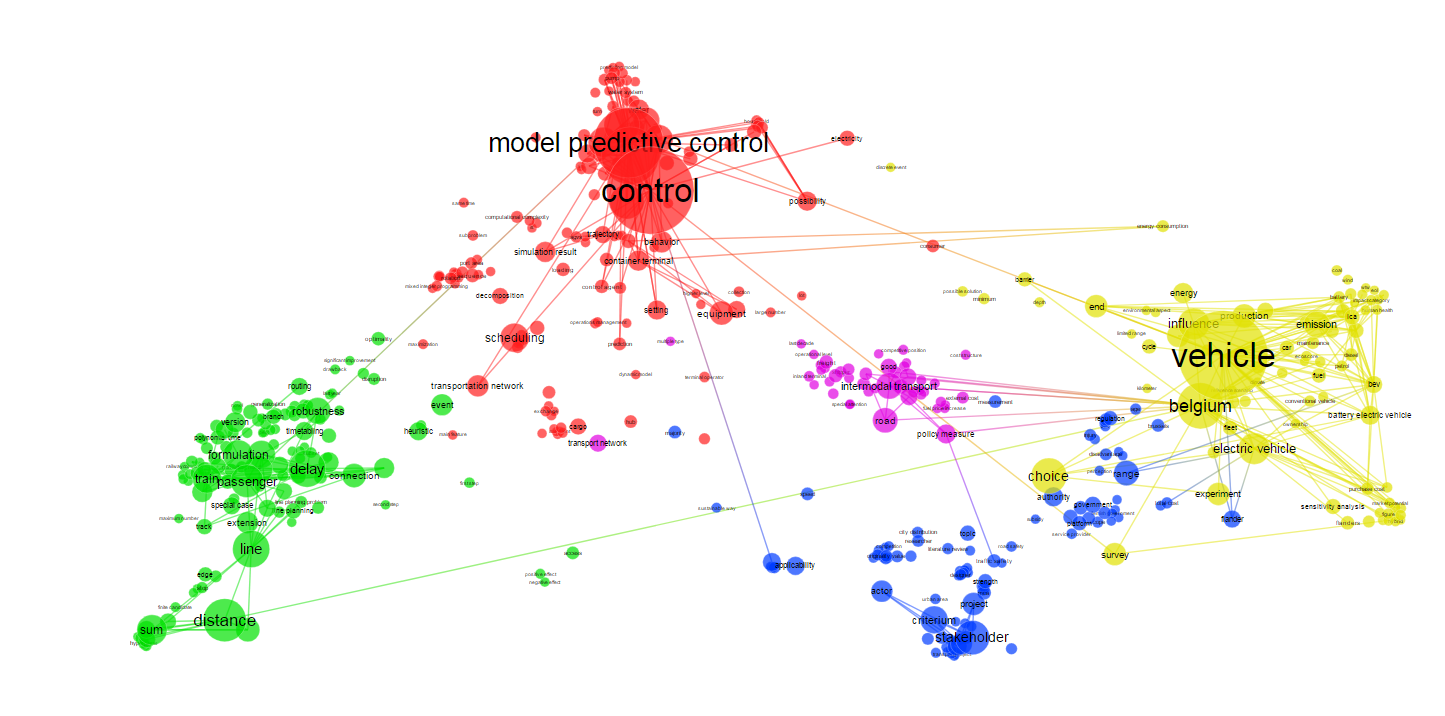
This term map visualizes the terms that appear in title and abstracts of articles submitted to a conference. The large circles indicate which terms are mentioned more frequently. The terms that are closer to each other and have the same color, that are automatically determined by the software, indicate the terms that co-occur very frequently. Data for this case study is provided by Mladena Lukovic, Dr.
What
illustrates the expertise areas of different members of a consortium
Why
to allow conference participants navigate through the terms mentioned in the submitted papers, and be able trace the terms back to the submitted articles
Who
group leaders and policy makers
How
1. collect the data of articles published by members of the consortium
2. generate a corpus and a score file such that in the score file you indicate to which author(s) each of the articles belongs
3. generate the term map based on text data (i.e., corpus and score)
4. use the overlay visualization feature to color the terms such that the color indicates how often the term is mentioned in publications of an arbitrary author
5. use the VOSviewer screenshot to export your map