Case 21: TU Delft top Collaborators (2)
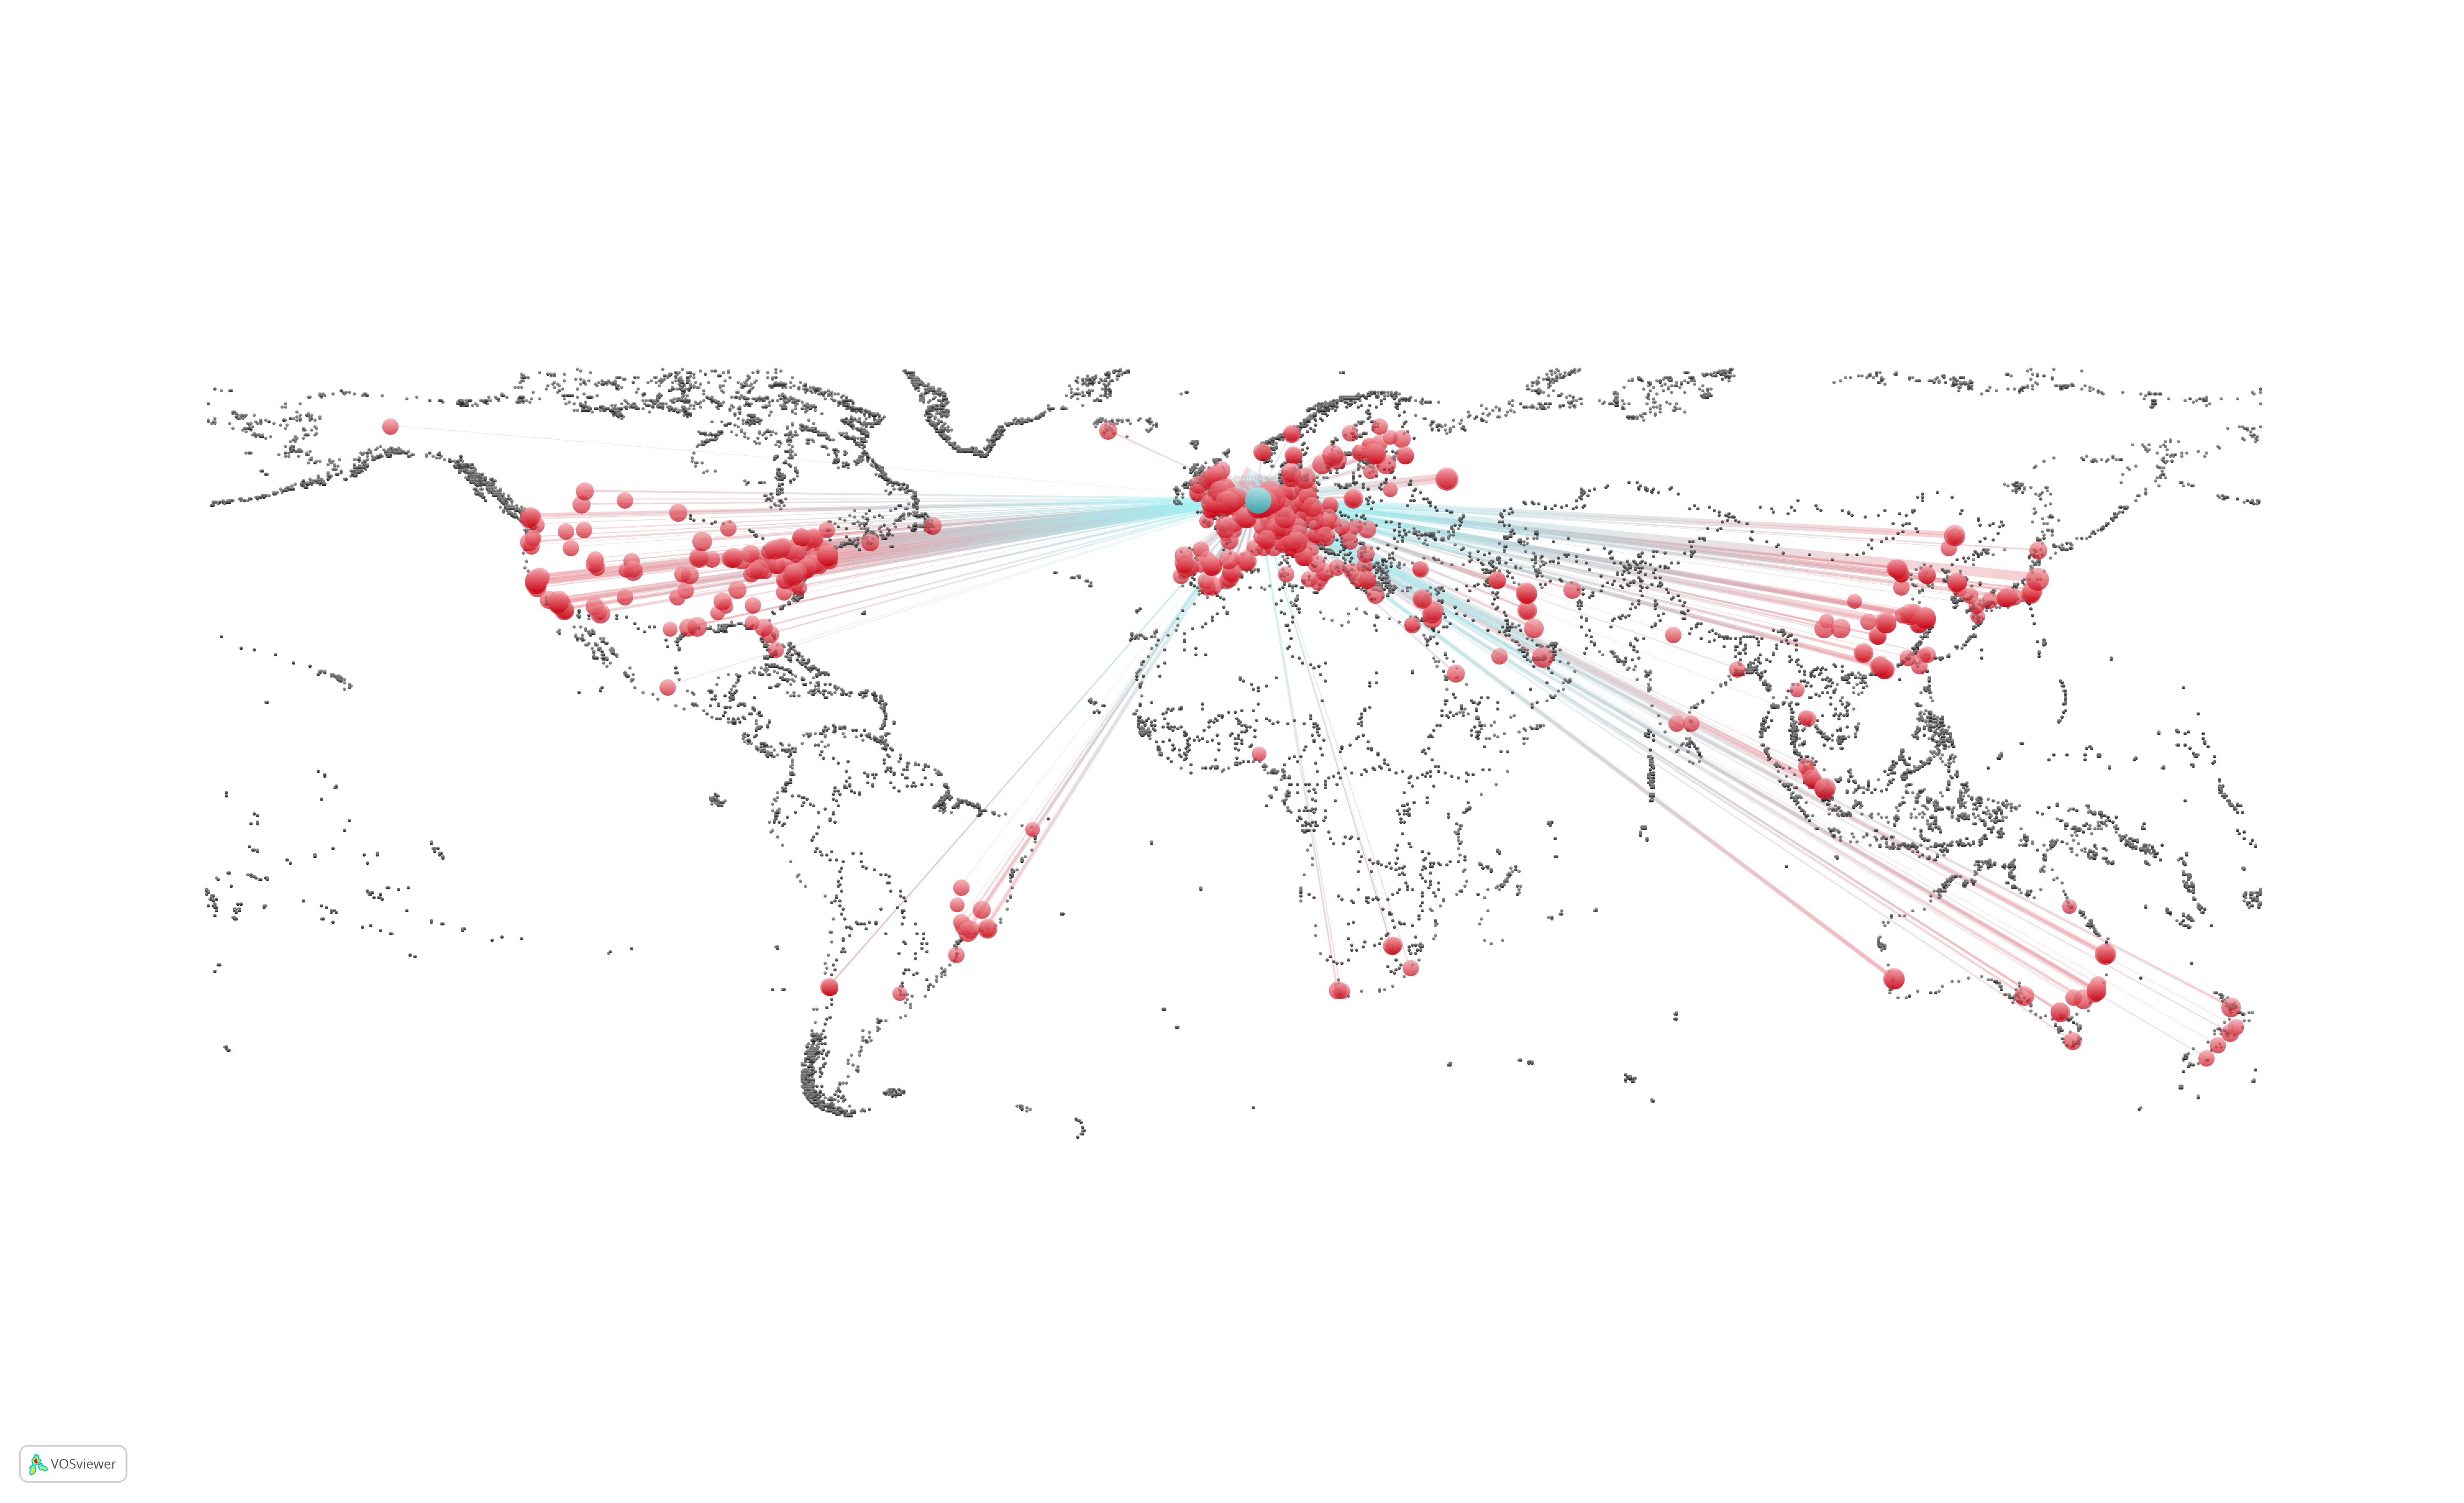
This collaboration map was generated based on research articles written by researchers at TU Delft from 2012 to 2018. Each red circle indicates an institution that has published articles together with the researchers of TU Delft (the blue circle), in the mentioned time period.
What
Shows TU Delft’s collaborators on a geographic map
Why
To identify TU Delft’s collaborators and the geographic areas with high or low density of collaboration
Who
PhD candidates, researchers, group leaders and policy makers
How
- Collect your data from an appropriate data source
- Import the data into VOSviewer
- Generate the co-authorship map based on bibliographic data in organization level
- Save the map file, and replace the values in x and y columns with the longitude and latitude of the corresponding institutions [you might need to collect this data manually]
- Add country border coordinates to your map file [see the country_borders_resolution_medium.txt below]
- Open the updated map file in VOSviewer, and keep on adjusting the visualization parameters until you get a nice look
- Use the VOSviewer screenshot to export your map
More information
using the files and instructions provided below you can generate a similar map in VOSviewer. The map is limited to only 20 collaborators of TU Delft.
List of files:
map.txt
net.txt
VOSviewer_settings.png
country_borders_resolution_low.txt
country_borders_resolution_medium.txt
country_borders_resolution_high.txt
Technical Instructions
After downloading the above files, open VOSviewer. Click on the ‘open’ button on left, and browse for map.txt and net.txt files in the two browsing fields. Click OK.
be a bit patient. loading the can take a few seconds.
After loading the map, adjust the following parameters:
- minimize the visualization scale to 0.5
- set the label size variation to 0.07
- set the max. length of labels to 0
- turn the background to black
the country_borders_resolution_medium.txt contains the coordinates of the nodes that represent the country borders. You can easily add your own set of institution nodes to this map for which you need the longitude and latitude coordinates (please consider that the higher resolution file takes more time to load, and the low resolution file is very fast).
Acknowledgements
The creative solution of using graph nodes to represent the borders and the coordinates of the country borders are taken from the ‘Map of Countries’ plugin of Gephi software developed by Clement Levallois (Levallois, Clement (2013). Excel/csv converter to network, Plugins-For-Gephi, DOI: http://dx.doi.org/10.5281/zenodo.17717).
This plugin, in turn, extracts the coordinates from the maps provided by Bjorn Sandvik, thematicmapping.org. The note attached to Bjorn’s dataset says: “Use this dataset with care, as several of the borders are disputed.”