Case 3: Citation impact
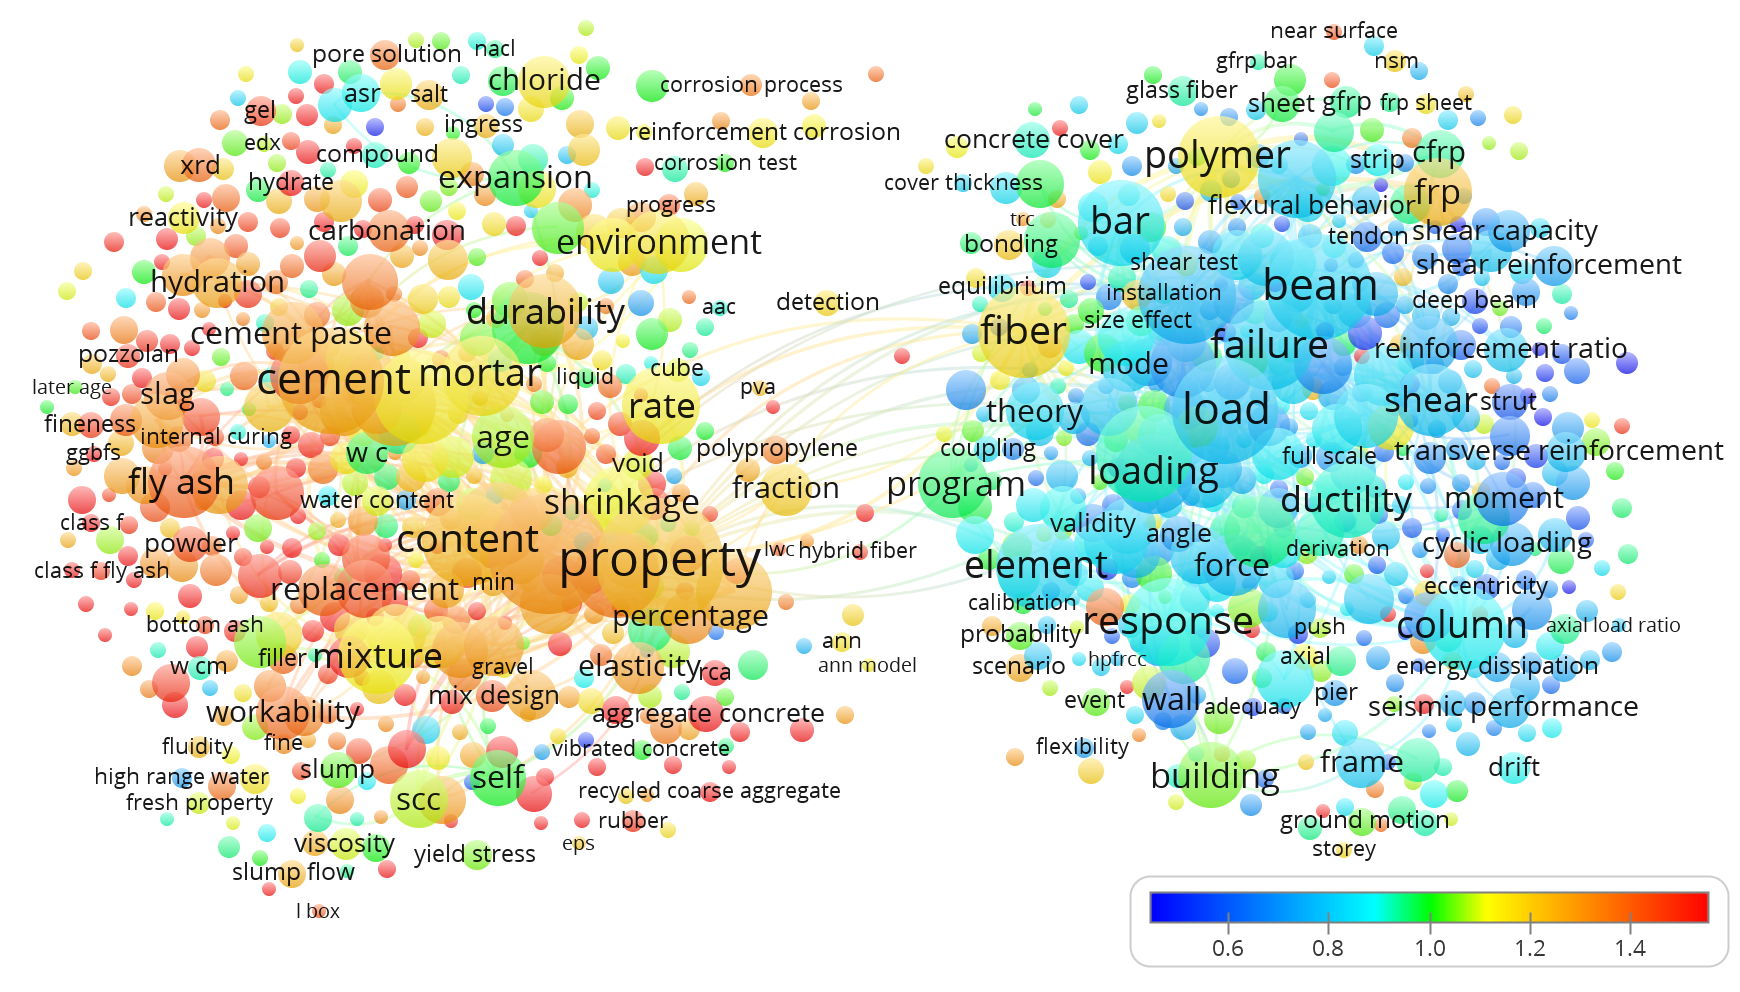
This term map shows the state of the art in research on Concrete. The overlay color of each circle corresponds to the average citation impact of all the papers that include the corresponding term. In this map, the terms with cold colors on right represent the research activities with lower impact compared to the terms with hot colors on the left side.
What
distinguishes the terms that have made a higher citation impact than the other terms
Why
To understand the trend of research from the past to present
Who
PhD candidates, researchers, supervisors and policy makers.
How
1. collect your data from an appropriate data source
2. import the data into VOSviewer
3. generate the term map based on text data
4. use the overlay visualization feature to color the circles with the citation impact corresponding to the terms
5. use the VOSviewer screenshot to export your map
Data
Download links:
Visualization
Data_1
Data_2
List of files:
data_1/
– scopus2000-2001-2002.csv
– scopus2003-2004-2005-2006.csv
– scopus2007.csv
– scopus2008.csv
– scopus2009.csv
– scopus2010.csv
data_2/
– scopus2011.csv
– scopus2012.csv
– scopus2013.csv
– scopus2014.csv
– scopus2015.csv
map.txt
net.txt
visualization_citation_impact.png