Case 4: Collaboration profile
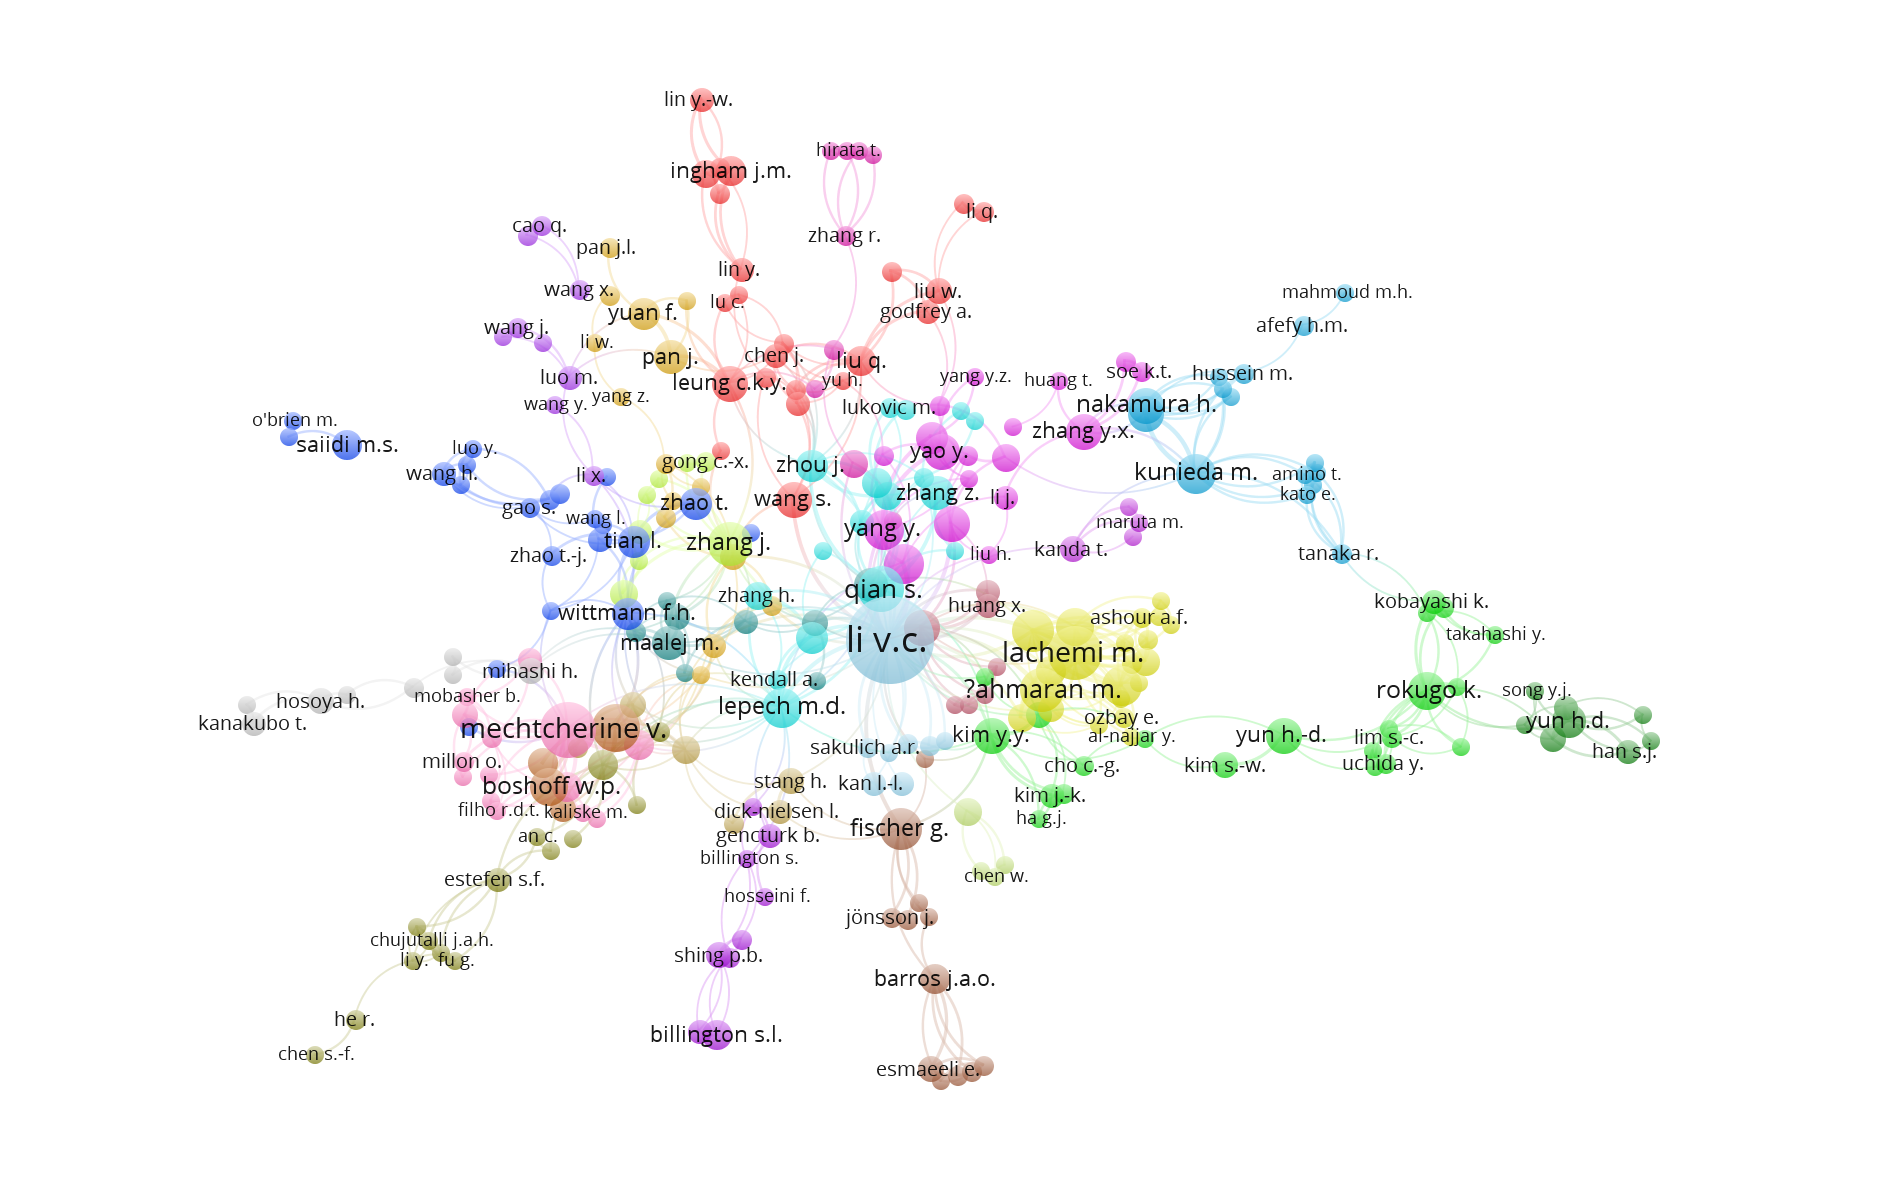
In this co-authorship map, different authors who are publishing papers in a specific domain are shown. The size of circles correspond to the number of publications of each author in the publication list, and the links between the circles show co-authorships in writing papers.
What
demonstrates the co-authorship patterns
Why
to get familiar with the role of researchers within their research team, and to identify active research teams
Who
PhD candidates, researchers, supervisors and policy makers.
How
1. collect your data from an appropriate data source
2. import the data into VOSviewer
3. generate the co-authorship map based on bibliographic data
4. use the VOSviewer screenshot to export your map