
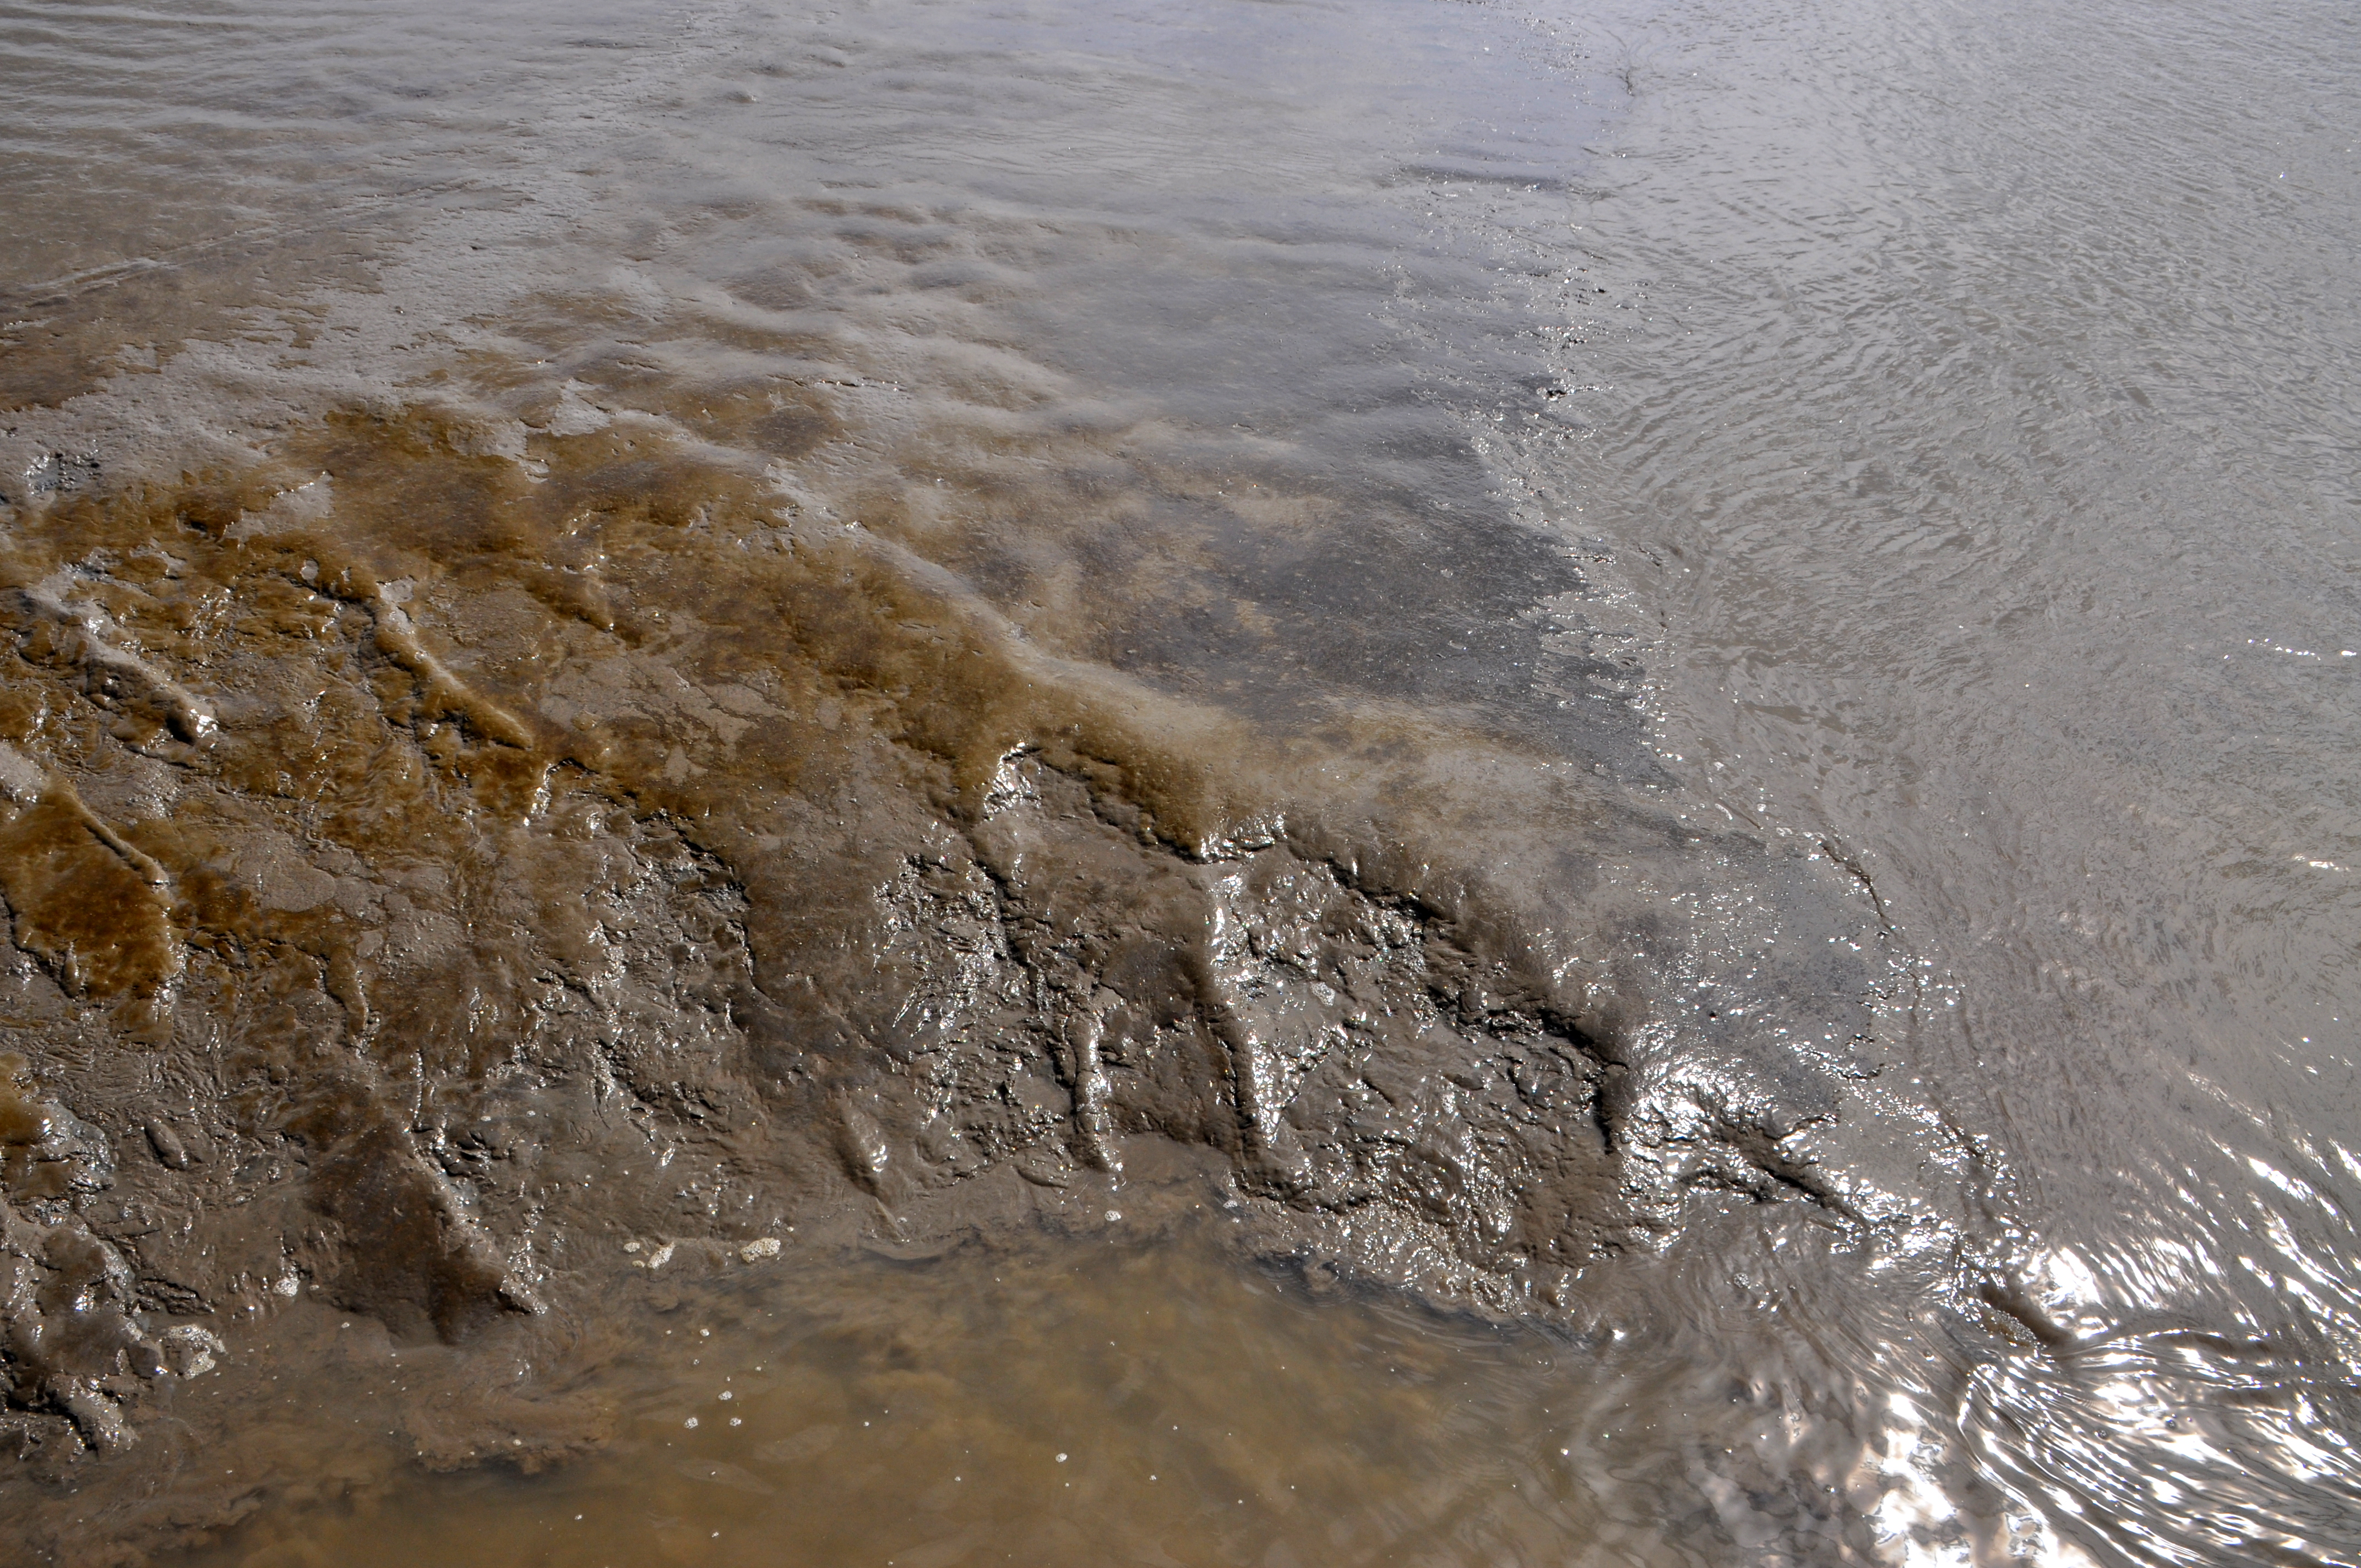
The River Ems and the Dollard inlet are located in the border area of northern Germany and the province of Groningen in the Netherlands. The water there has almost completely clouded up to the extent that it resembles liquid mud. Why is that?
"It's caused by silt, a muddy substance that consists of clay particles and dead organisms. The amount of silt has been increasing over the past decades and parts of the river are basically now just liquid mud. This impedes the growth of algae, that are at the base of the food chain. Algae are the food of shrimps and shellfish, which in turn are eaten by birds. This has led to severe ecological degradation of the area and there is now almost no life left in the water."
But how did all that silt get there?
"We're not exactly sure of the answer yet, which is why we are currently researching this. What we do know, is that much has changed over the past decades. For example, the Ems has been dredged to make it considerably deeper, for instance to cater for the increasingly larger cruise ships being built at the Papenburg shipyard in Germany. But land reclamation around the Dollard inlet has probably played a role too, because this has reduced the size of the estuary. We also want to know more about the origin of the silt and where it ends up. Before we can arrive at solutions to reduce the amount of silt and make the water clearer again, we first need to understand which processes affect this ecosystem. Otherwise there is no point changing anything; you might even end up making things worse."
How are you conducting your research?
"We're studying various factors that all influence the transporting of silt. One of these is the distribution of sediments throughout the water column, i.e. from the surface of the water to the bottom of the river. We also want to find out where the silt is entering the water and we are examining what happens under hyper-turbid conditions, which occur when a large amount of sediment collects in one place in the water. This influences the flow of the water and so changes the distribution of the silt. In short, we're studying a whole lot of things at once."
You are developing a model of the Dollard and the Ems to gain a better understanding of the processes at work. What kind of model is this exactly?
"Large numeric models are already being used by the Directorate-General for Public Works and Water Management and the Deltares applied research institute among others. However these models are not tailored to the situation in the Ems. As mathematicians, we are developing a new model that can be seen as complementary to the numeric models. One of the ways we are doing this is by looking into the past. The water was not hyper-turbid in 1965 and the area was ecologically healthy back then. We are curious to know what has happened since. If we know exactly what caused the turbidity, it will help us predict the effects of future interventions."
In the past, among other things, water was not hyper turbid. If we know exactly what caused this, we can better predict the effect of future interventions.
How do you know what the situation was in 1965?
"It was anything but easy to find out. We didn't know if any data was available, so we just drove to the German city of Emden and tried our luck. We ended up in an archive in an attic with cupboards full of stacks of paper. It was a wintry day, there was no heating in the attic, and it was cold and draughty. We leafed through the papers, hoping to find something useful. And we did! We found tidal data from 1965; the numbers had been written by hand on a large sheet of paper. We also found soil maps with depth indications and samples of soil profiles from various years. We were very happy with this information, because it allowed us to reconstruct the situation in 1965. We discovered that in later years, and in particular from the 1980s onwards, the river became deeper and deeper and there was less underwater friction. The increase in silt made the river bottom muddier but also smoother. This resulted in less turbulence and other water movement, which was also reflected in the water levels. In 1965, the water level on the seaward side was higher than inland. It's now the other way round."
How did these discoveries improve your model?
"We now have a better understanding of which processes played a role. Our model can describe what has changed between 1965, our baseline, and today. This will also tell us more about the role of turbulence and friction underwater during this period. When the river was made deeper, it also meant more sediment was introduced into the system. This decreased friction and turbulence which in turn led to more sedimentation. This was the cause of the extremely high sediment concentrations. There are other aspects, though, which we're still unaware of, such as the influence of the sediment on the mixture in the water column, from the surface of the water to the bottom of the river, and how this changes under the influence of the tide."
In early September, a major survey was carried out involving no less than eight ships all across the Ems. How important was this?
"One of the things the survey measured was the influence of the tide on the transport of silt. We can use this information to improve our model. It’s an interactive partnership; we can tell the survey team what information we need and then input the results into our model to improve it. That is why the September survey focussed on what happens to the silt in the river under the influence of the tide."
"Of course, the survey gathered a lot of other data too. We used special vessels to measure the water velocity, silt and salt concentration, and turbulence. Four ships were anchored in one place, while three others sailed back and forth across the flow of the river. One boat went from Papenburg in Germany and sailed downstream through the Ems estuary and into the Dollard inlet. This provided us with information about specific sites, but also about possible differences in the water over a long distance."
The survey involves a large number of parties mainly from the Netherlands and Germany. It is being coordinated by the Directorate-General for Public Works and Water Management and Royal Haskoning, but TU Delft, the universities of Oldenburg, Maine and Rostock (Warnemunde) and many local authorities are involved too. What is it like to work together with so many different parties together?
"We need all these partners, because otherwise we cannot produce a complete picture of the estuary. This is a huge project that encompasses a large region in two countries and involving an enormous number of measurements. That costs a lot of money, so you can only do it if you join forces. For example, we are using vessels provided by partners and highly specialised measurement equipment. We get together a few times a year to discuss progress and participate in workshops. I know almost everyone involved and we all work together well. We're now waiting for the data from the most recent survey to be processed. The results are expected in early 2019. We'll import this data into our model too, and of course use it in publications. Similar areas such as the Scheldt estuary and some regions in Asia where heavy dredging takes place could also profit from our findings. It is in all our interests to cooperate, because it decreases costs and inconvenience, the river will be made safer and we'll generate knowledge we can all use."

You were on board one of the research vessels during the survey. What was that like?
"I sailed with one of the boats for three days. One of the measurements lasted 13 hours. We measured silt concentrations, among other things. I had to pull up a bottle filled with water once every twenty minutes. This gave me even more respect for the people who do this work on a daily basis. It is hard work on board. Ideally, I would have preferred to have collected data over a period of three months. It’s easy to think up a plan like that sitting at your desk just because you want the information, but it’s not really something you'd ask people to do, to work for so long on a project."
"I also enjoyed talking with the captain. While on board, I noticed that parts of the river flowed constantly while other parts did not. The captain explained that this is common and is caused, among other things, by small rivers branching off from the main flow. I was surprised to learn this. We spend all our time measuring and making calculations about the Ems, mainly searching for patterns, and so we view the river as a single system. By sailing with a survey vessel, I gained new insights and came to see the river in a new light."


Henk Schuttelaars (1970) graduated Utrecht University in 1993 with a degree in physics. He obtained his doctorate at the same university in 1997 on the analysis of underwater soil patterns. He then participated in various projects at TU Delft and Utrecht University as a post-doc. Schuttelaars has been associate professor at TU Delft since 2006. He is currently building a new model to develop a better and more detailed picture of how silt behaves in the River Ems and the Dollard inlet. He hopes this will allow a better understanding of how silt has developed in the Ems estuary.