Activate high contrast To main content
Home of TU Delft
  • Home
  • Tools & Models
    • Rooftop Scan
    • Detailed PV System Design
    • Dutch Solar Energy
    • Virtual PV system case
  • Meteorological data
  • PV Monitoring
    • TU Delft Campus Installation
    • PV Monitoring station
    • INNOZOWA
    • E-Bike charging station
    • The Green Village
    • DCES&C PV system
    • PV power databases
  • PV power databases
  • PV Education
    • PV: How it works
    • Yield model explanation
  • About
  • Home
  • Tools & Models Menu sluiten
    • Rooftop Scan
    • Detailed PV System Design
    • Dutch Solar Energy
    • Virtual PV system case
  • Meteorological data
  • PV Monitoring Menu openen
    • TU Delft Campus Installation
    • PV Monitoring station
    • INNOZOWA
    • E-Bike charging station
    • The Green Village
    • DCES&C PV system
    • PV power databases
  • PV power databases
  • PV Education Menu openen
    • PV: How it works
    • Yield model explanation
  • About
  • socmed

    • facebook
    • twitter
    • instagram
    • youtube
    • linkedin
    • whatsapp whatsapp
Nederlands
  • Dutch PV Portal
  • Tools & Models

Calculation tools & models

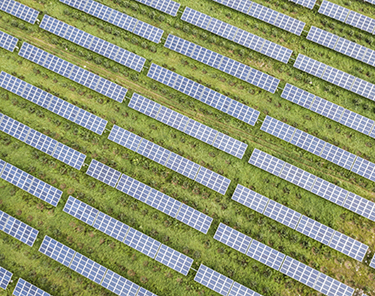
Design a PV system for your location within the Netherlands, view the simulated solar power production of the whole Netherlands or find out what solar panels could offer you. Discover and play around with the several online, free-to-use tools and models developed within the PVMD group.

Quick Rooftop Scan

Are you considering to install solar panels on your roof? Use this easy Rooftop Scan to quickly find out if your roof is suitable for solar panels and how much you could possibly save on your electricity bill.

Detailed PV System Design

Design a detailed PV system for any location within the Netherlands and let the model calculate the performance and economics of this system. The calculations are based on the real-time weather and climate data from the KNMI (Royal Dutch Meteorological Institute).

Dutch solar energy production

Mouse over and have a look at today's Dutch solar power production in this interactive graph. Would you like to get an idea of how solar power in the Netherlands is growing? Click here to view the Dutch daily and annual solar energy production in detail.

Virtual PV System Simulation

View the simulation results of a 6.9 MWp virtual solar power plant in the province of Zuid-Holland. Real-time weather data and the PV Portal performance calculation model are used to calculate the power production of this system.

The Dutch PV Portal

Dutch PV Portal 1.0 created by Arianna Tozzi
Dutch PV Portal 2.0 created by Veikko Schepel
Dutch PV Portal 3.0 created by Marianne Klement

Sent your feedback or questions to: Olindo Isabella

Disclaimer

   
Home of TU Delft
  • Home
  • Tools & Models
    • Rooftop Scan
    • Detailed PV System Design
    • Dutch Solar Energy
    • Virtual PV system case
  • Meteorological data
  • PV Monitoring
    • TU Delft Campus Installation
    • PV Monitoring station
    • INNOZOWA
    • E-Bike charging station
    • The Green Village
    • DCES&C PV system
    • PV power databases
  • PV power databases
  • PV Education
    • PV: How it works
    • Yield model explanation
  • About