
Subsidence in the Netherlands greater than expected
Although we have long suspected that land in the Netherlands is subsiding, the first nationwide measurements to prove it have now been published. Subsidence is much greater than expected, especially in the western part of the country. This is according to data from the new Dutch Land Subsidence Map (Bodemdalingskaart Nederland) presented this week by the Netherlands Center for Geodesy and Geo-informatics (NCG).
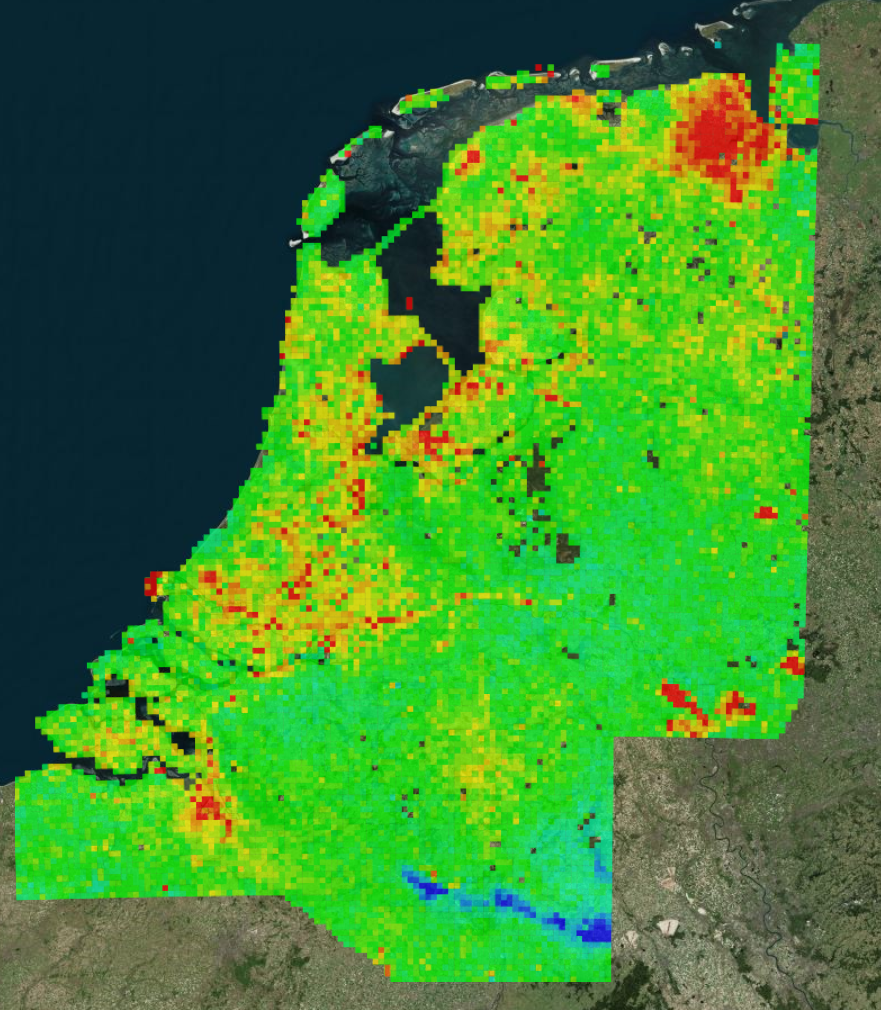
Interactive map
A team of researchers led by Prof. Ramon Hanssen (NCG / TU Delft) have incorporated three different types of measurement data into the underlying model: satellite radars, GPS and gravity measurements. The data has been used to create an interactive map on a website accessible to the public: bodemdalingskaart.nl. Because the map not only shows the different types of soil in the Netherlands, but also the location of oil and gas fields, it clearly reveals the causes of the subsidence observed. The map is kept up-to-date using the latest satellite data released on a daily basis. This makes it possible, for example, to track whether subsidence decreases if less gas is extracted in Groningen.
Shallow subsidence
The map has enabled researchers to distinguish for the first time between the deep causes of subsidence, such as gas extraction, and the effects in the uppermost few metres. Until now, it was not possible to directly measure this top layer. It turns out that this ‘shallow’ subsidence is even greater in some places in the Netherlands than the more familiar, deep causes. In the peat and clay areas in the west of the country especially, this subsidence is now clearly measurable. Its effect over the last summer is also noticeable, with dozens of houses showing cracks and subsidence caused by the dry weather. Climate change appears to play a major role in this accelerated subsidence. The relatively warm summers are dehydrating peat soils, speeding up subsidence. This process is irreversible: the peat oxidises, which also means that more CO2 is released into the atmosphere.
Serious problem
According to Prof. Hanssen, the picture revealed by the map clearly demonstrates how serious the problem of subsidence in the Netherlands really is: ‘If the subsidence continues at its current pace, it could mean the end for the typical Dutch landscape of meadows, cows and windmills or cause huge damage to historic city centres’. The PBL Netherlands Environmental Assessment Agency (Dutch, pdf, p. 8) estimates that this damage could reach € 22 billion by 2050.
However, the fact that this can now be measured effectively is good news. Water authorities will be able to use the measurements in order to improve their water level management, for example, by anticipating periods of drought more effectively.
About the Land Subsidence Map
The bodemdalingskaart.nl project is an initiative of the Netherlands Center for Geodesy and Geo-informatics (NCG), the same organisation that initiated the Amsterdam Ordnance Datum (NAP) water-level measurements, designed the first continuous Netherlands’ GPS network and pioneered the Actual Height Model of the Netherlands (AHN). Various universities, knowledge institutions and businesses are also contributing to the result: TU Delft, Royal Netherlands Meteorological Institute (KNMI), HU University of Applied Sciences Utrecht, University of Twente, SkyGeo and 06-GPS.
More information
Contact info: http://www.tudelft.nl/hanssen
TU Delft Science Communication Adviser Roy Meijer, r.e.t.meijer@tudelft.nl, +31 (0)15-2781751
Mediapack: via Google Drive of via WeTransfer (44 Mb)
Image: Oostpolder - veenweidegebied, Hardscarf (via Wikipedia)