One of the most important measures we can take to prevent the spread of the coronavirus is to maintain a distance of 1.5 metres from each other. To be able to put this into practice, we need to know how people move around and how this changes over time. We are studying our own campus to gain insight into this.
Where and when do you need to take measures to reduce crowding, and just how effective are they? A special network has been installed on the TU Delft campus to provide answers to these questions. Sensors in the network convert visual information into privacy-proof data, showing pedestrians and cyclists as moving dots. This information is combined with publicly available data such as the opening times of bridges and real-time locations of trains, buses and trams.
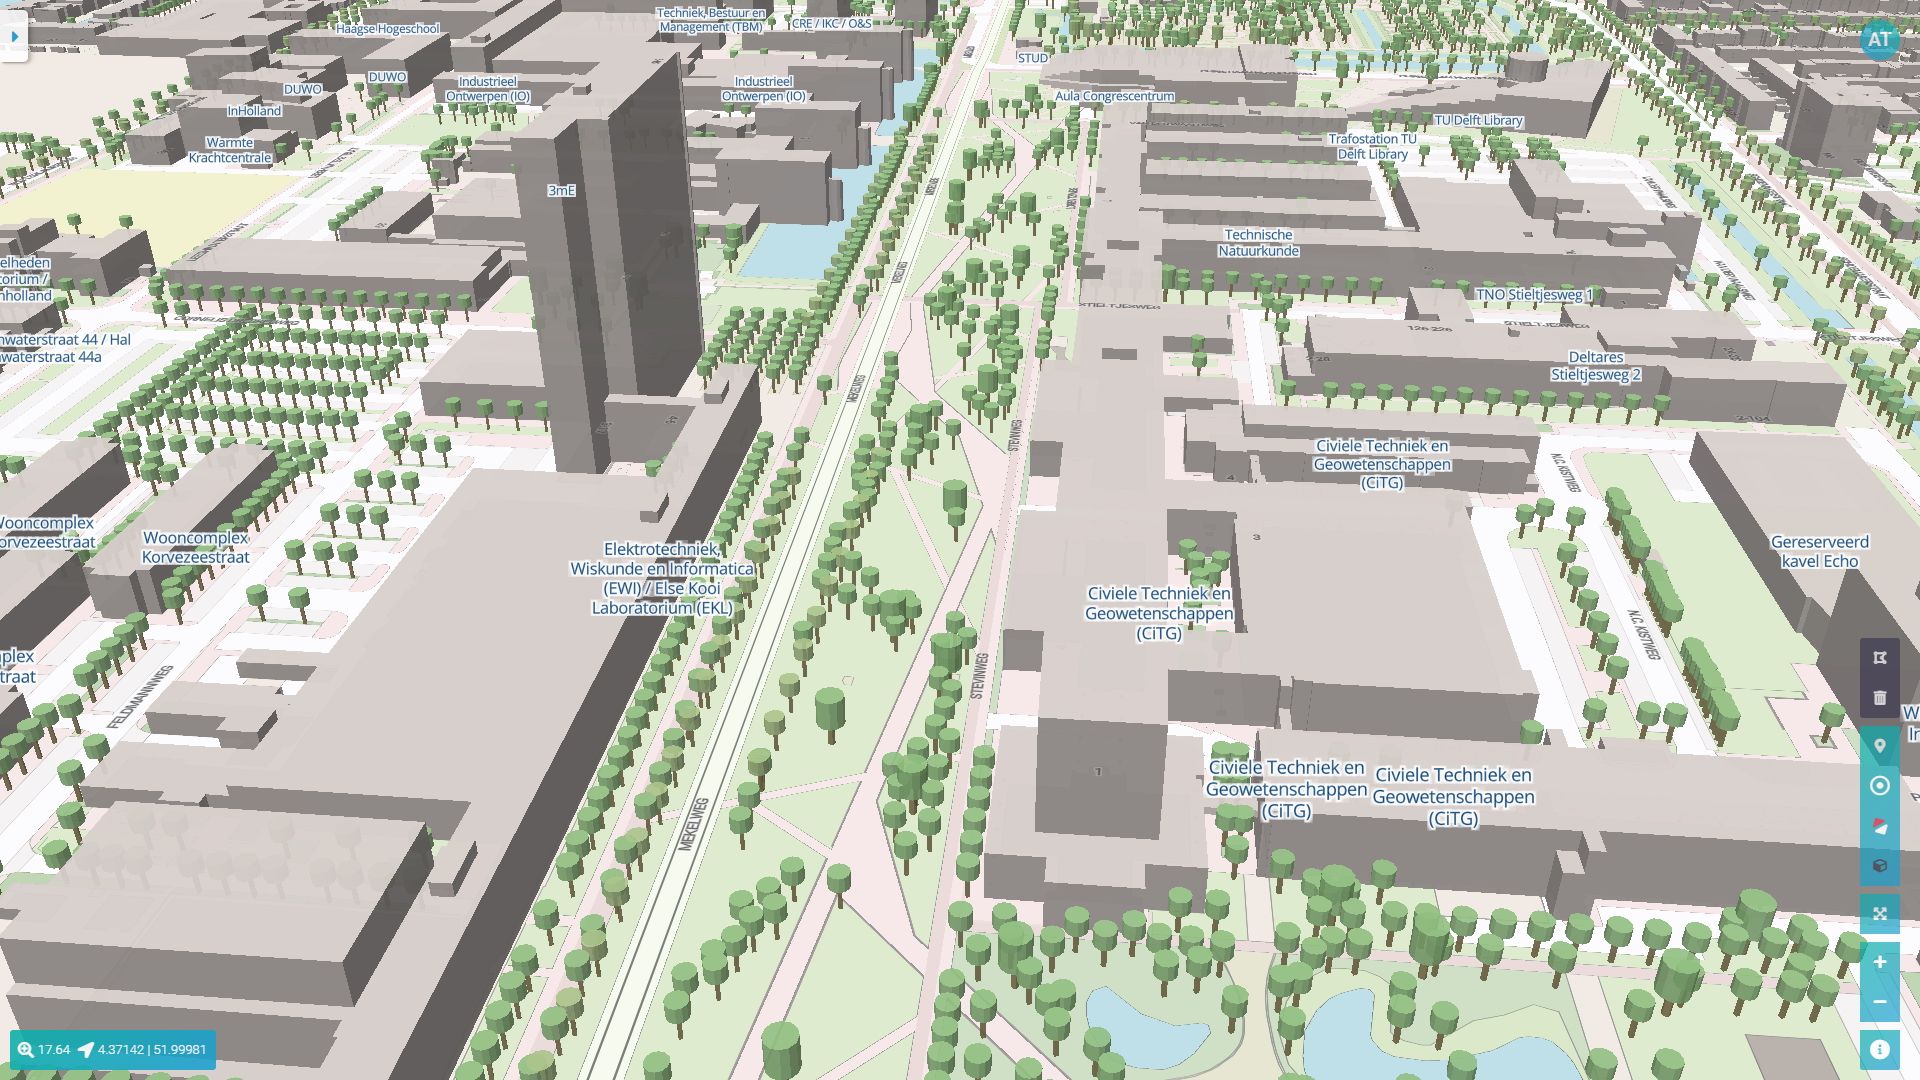
Digital twin
The combined information is visualised in the Campus Mobility Dashboard, a digital twin of the university campus. This 3D model uses heat maps (colour coding) to indicate how busy it is at a certain location, for example. In the current situation, this lets the campus management know the extent to which maintaining 1.5 metres social distancing is feasible, and it flags up critical locations. This information can be used to initiate measures, ranging from advice to take different (less busy) routes, to travel at a different time or use an alternative mode of transport, to changing lecture timetables or implementing one-way traffic on cycle paths.
Predictions
Besides flagging congestion, the system is ultimately intended to make predictions about movements and crowding on campus, both short-term (15 minutes ahead) and long-term (days, weeks and months). Methods already exist that use technology such as artificial intelligence and machine learning to successfully predict traffic flows for car traffic. The researchers will now be trying out these methods on far more complex processes such as pedestrian and cyclist flows and flows within public transport.
Insights into behaviour and perception
Such predictions require more insight into human behaviour, which is why the study also focuses on the question of how pedestrians and cyclists move in relation to each other, how people behave in crowded areas, and the extent to which they are willing to use public transport. Changing norms play a role in this as well. Covid-19 is changing the way people perceive crowding: not only the average amount of crowding plays a role, but also the distribution of people throughout the space. How do people respond to this? Do they take quieter routes, or avoid using public transport? And how do measures and advice influence this behaviour? And how can we capture this behaviour in mathematical models?
Mobility Lab
Of course, knowledge about mobility is not only useful during the current pandemic but will continue after this as well, for example when calculating new spatial and mobility plans. This is why in the future the sensor network needs to grow into a fully-fledged Mobility Lab for scientific research. For this, we are working on developing new and cheaper sensor technology that will provide reliable measurements.
An associated issue is being able to optimally combine various data sources in order to extrapolate more accurate information (data fusion). This is a tricky task, given the diversity of data from the various sensors, yet it can potentially lead to a higher quality of information and also generate new information. For example, combining data from public transport companies with information from the sensors could enable us to make more accurate estimates of the occupancy of buses serving the campus.


Fernando Kuipers

Marco Antonio Zúñiga Zamalloa
