
Flash floods in Peru
Luisa Torres Duenas
Having started a master’s degree in the fall of 2016, Luisa Torres Duenas always knew that she wanted to work for Deltares on flood risk. Now working on her thesis, the Colombian native shares how she created a flash flood risk index for Peru.
Where did your passion for hydraulic engineering come from?
I was always intrigued by the side of hydraulics that focused on big constructions, like dams and dikes, and my university couldn’t offer me that. I decided to get some professional experience so I worked in Brazil for three years and got to work on structural waterproofing for tunnels and dams, so really big projects. It was seeing those big infrastructure projects that made me decide I was in love with it.
Now I deal with coastal flooding and inland water issues and we learn how to assess and understand flood risk in order to implement adequate floodplain management strategies that benefit and protect entire communities.
How did you end up doing an internship at Deltares?
It was always my idea to work at Deltares because it’s an institution that I knew of even in Colombia. My first year was full of mandatory courses and then this year I got to do the internship combined with my thesis. I think I sent around 100 e-mails to every company that I knew was doing flood related issues and after a while I got a response from a Deltares.
Your project focused on flash floods in Peru. What was the problem?
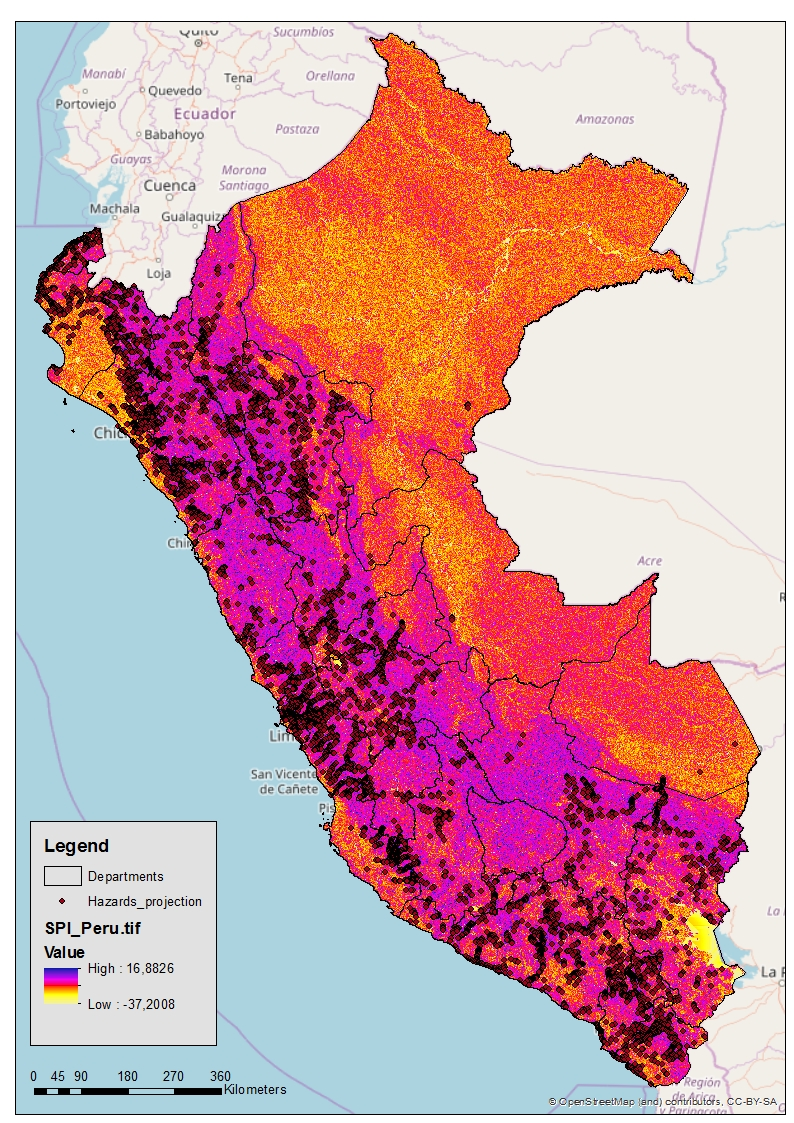
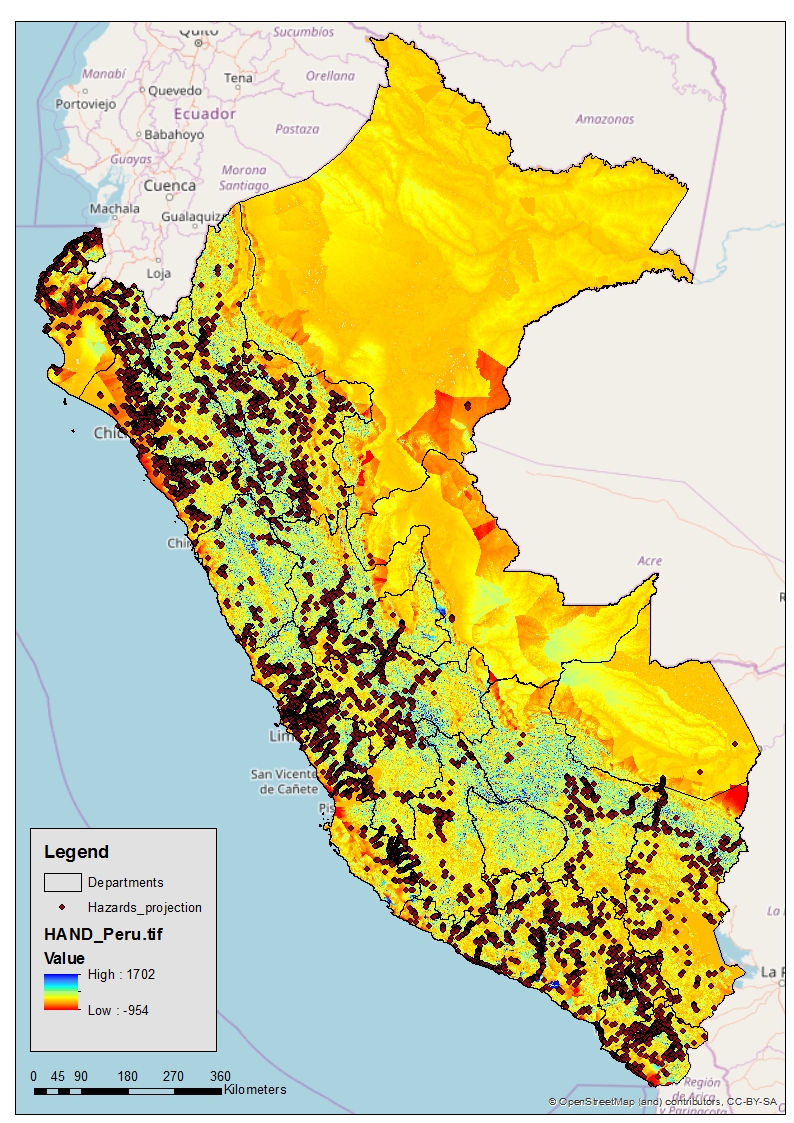
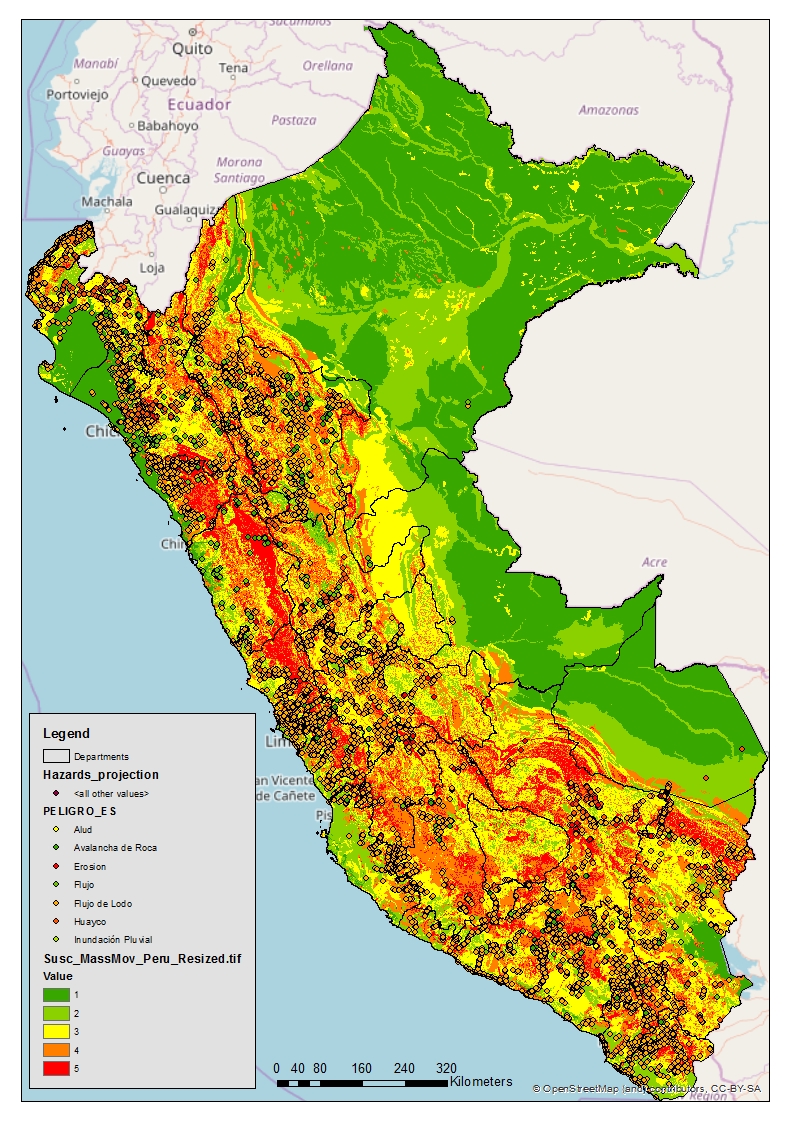
In early 2017 due to the rainy season there were many catastrophes in Peru related to flood issues and especially flash floods. That is the case for many South American countries where we have rough topography. We wanted to try to build an index showing the risky spots in Peru in which there is a higher probability to have one of these events. We tried to create a map using several layers, representing areas susceptible to flash floods, with high slopes, high intensity precipitation, and certain types of soils in addition to other parameters relevant for flash flood development. We collected all of this information and then I processed it in GIS software called ArcGIS. We tried to find the correlation of each layer, trying to explain the locations of flash floods. It took me around 6 months to get everything running and we have a set of data now that can be used for further research.


What challenges did you face during the project?
Building up maps on this scale is difficult, especially because Peru is a big country. I spent a lot of time gathering data in the beginning. Peru has a large amount of data compared to other countries in South America, but we also tried to work with global data so that we could replicate the model that we were using in other countries that have scarce data. There was also a challenge regarding validation of the data collected.
In the beginning of the project the idea was to collaborate with Peruvian authorities since in Peru there is not a clear definition of what a flash flood is. Nevertheless due to the magnitude of data processing and collection, this was left for another phase of the project. The idea is to visit Peru for some weeks to work on the validation and correction of local data to achieve the final calibrated index risk map.
What do you think was the impact of your work?
In South America, flash floods are one of the most damaging hazards and nonetheless the topic is rarely studied in detail. The complexity of the phenomena is commonly overlooked and mixed with pluvial and riverine flooding so there are not any particular actions towards the mitigation or prevention of these type of events. Having an initial indicative flash flood risk index on a national scale helps towards the contribution of filling this knowledge gap and sets the first steps towards implementing preventive measures. Also, it can indicate which regions deserve a more in depth analysis such as numerical 2D or 3D models that could resolve debris flow to better understand the flood extent and associated damage.
What we did for Peru could be easily applied to other countries with similar topographic conditions since we based our research on globally available open data sources. Maps such as the ones we are proposing can serve as an initial tool for flash flood risk assessment and could potentially drive particular flood risk management strategies. In addition doing this for a developing country such as Peru, gives a good example of what applied science and research can do for a community, so showing this to local authorities can enhance the importance of investing in research and therefore connecting science with industry and government policies.
What did you learn from your experience?
A lot of times when you do an internship you’re part of a huge project and you just deliver a small part of it. On this project I was completely alone. It was a really intense learning process during the six months. It was challenging, but you really got to see what it’s like to be in a professional environment that mixes the academic knowledge with industry.
A lot of times you finish your studies and when you go to work you forget about a lot of what you learned because you don’t use it. In Deltares that’s not the case because it’s knowledge based. You’re always doing research and applying the things that you learned at university so it’s a really nice balance. In Deltares you really see what science and research can do for society so it is a really rewarding process. In addition, you are involved in innovative projects all around the world since everyone looks up to the Netherlands for advice regarding water related issues.
More information: