Organizing high-dimensional data with triangles and fields
Fast rendering of triangles appears to have little in common with neural networks. They are, however, linked by a clever insight by Nicola Pezzotti. Exploring the similarities in high-dimensional data through visualization no longer takes tens of minutes on a fast computer. The required computations can now be handled in real-time by a web browser. His breakthrough research is ideally suited for the validation of neural networks. But biomedical researchers at the LUMC are eager users as well.
“The mathematics of algorithms and scalability problems. That’s what makes my heart beat faster,” says Nicola Pezzotti, PhD-student in the Computer Graphics and Visualization group. He thinks of himself as an archetypical computer scientist, but the first ten minutes of our interview he highlights a number of practical applications of his work, with great enthusiasm. In a collaboration with the LUMC he discovered new cells of the human immune system. They also identified new differentiation stages of stem cells. “Our data visualization indicated their existence. Knowing what to look for, the LUMC researchers were able to detect these cells.” The most important application of Nicola’s research, however, is the validation of neural networks. Some background knowledge is required to understand his work on the t-SNE algorithm (t-distributed Stochastic Neighbor Embedding).
Many dimensions
Nicola’s work isn’t so much focused on big data, as it is on high-dimensional data. “This means that each data point has very many characteristics,” says Nicola. “In the LUMC they can determine the presence of tens of different proteins on the surface of individual cells. That makes each cell a data point with tens of characteristics.” Visualizing these data would require tens of dimensions, something humans can’t handle. Other examples of high-dimensional data are pictures of animals or hand-written numerals. When

digitized, a computer can process and organize these. But with each pixel a variable (color, intensity, etc.), each data point has up to thousands of characteristics.
Warping space
Whether it be the recognition of pictures of animals or the discovery of genes that may play a role in developing breast cancer, deep neural networks are the power tool to find similarities in such high-dimensional data. “After a neural network has been setup for a particular application, it has to be trained,” Nicola explains. “This requires a large set of training data. Pictures of animals, for example. The network will look for similarities that we know or suspect to exist.” The goal could be for the network to differentiate between a parrot, a pigeon and a giraffe. You tell the network what each training picture represents, and it will look for the characteristics that, apparently, fit this description. ‘Colorful’ can be one of the descriptive characteristics for ‘parrot’. “You can think of a neural network as warping high-dimensional space,” says Nicola. “Pictures of the same animal will then form high-dimensional clusters, even if there is quite some distance between these data points in the unwarped space. When the network has been trained, it will be able to instantaneously label any new picture based on its location in high-dimensional space.”
An elephant is not a pigeon
It is, however, a bit more complicated. “The output of a neural network is also high-dimensional,” Nicola explains. “It is a series of numbers, a so-called feature vector, with each number a probability.” The first number may be the probability of the new image being a parrot, the second number the probability of it being a pigeon, and so on. All these probabilities add up to unity, to one hundred percent. “If the network hasn’t been properly designed or trained, it can’t distinguish between the various animals,” Nicola explains. The network may then label all parrots and pigeons, or all winged creatures, as one and the same animal. And if the pigeon is the only gray animal in the training set, it may label an elephant and rhinoceros as such. Developers also want to compare two or more neural networks. Which one is best-suited for the task? “A visual representation is an effective method to judge the quality of a neural network, or to determine whether or not more training is needed,” says Nicola. Humans can only deal with up to three spatial dimensions. Therefore, plotting the (warped) high-dimensional space ‘within’ the network is not an option. But certain algorithms can provide insight into the similarities that exist in a high-dimensional data set, such as the output of a neural network. Nicola’s research focuses on the t-SNE algorithm, which is especially well-suited for this task.
Neural networks versus t-SNE
Once training has been completed, a neural network can instantaneously classify new data. It can, for example, label a single subsequent picture to be ‘a parrot’. The t-SNE algorithm visualizes the similarities within a high-dimensional dataset. Its output is a graphical representation of clusters of data points, without any indication whether a cluster represents, for example, ‘birds’ or pictures of ‘a parrot’.
Back to two dimensions
In 2008, Laurens van der Maaten - a former associate professor of TU Delft and now researcher at Facebook AI - published his t-SNE algorithm as an improvement of the existing SNE algorithm. The goal of both algorithms is to visualize the similarities in a high-dimensional data set by means of a representation in a reduced number of dimensions. “This can be a three-dimensional representation, but in my work, I focus on the representation in a two-dimensional plane (2D),” says Nicola. “It is essential that the low-dimensional representation preserves the characteristics of the high-dimensional data, such as their clustering.” Nicola explains that the t-SNE algorithm is a two-step process. Imagine a dataset of a few hundred thousand feature vectors, the result of feeding pictures of animals to a trained neural network. First, the algorithm determines the (high-dimensional) distances between all feature vectors. Data points that are alike, with little distance between them, will form a cluster in high-dimensional space. Second, the algorithm uses a process of optimization to search for the 2D-representation of all data points that best matches these high-dimensional distances. Data points that are alike should be clustering in 2D as well. Likewise, there should be large 2D distances between data points that are not alike in high-dimensional space.
Attractive and repulsive forces
The algorithm translates the distances between data points into attractive and repulsive forces. The more similar two data points are, the larger the attractive force. “All data points are at least somewhat similar,” says Nicola. “It is therefore important to have a repulsive force as well, or all points may end up forming a single blob.” The original SNE algorithm was slow because it calculated both forces between all data points. “In this case, the number of calculations of distances and forces scales quadratically with the number of data points, as does the computing time,” Nicola explains. “And you need many data points to get an intuition for the quality of the neural network.”
It is this quadratic explosion in the number of calculations that makes the t-SNE algorithm a scalability problem, one to which Nicola is particularly drawn. Over the years, the original SNE algorithm has been improved a number of times. The t-SNE implementation by Laurens van der Maaten limited the calculation of the attractive forces to those points already in close proximity. “The attractive forces are very small for data points that are unalike, that are far-removed. They can therefore be ignored,” Nicola explains. It was Nicola himself who recognized that the distances between the high-dimensional data points could be calculated with some inaccuracy. “This dramatically reduced the computation time without sacrificing the end result.”
Einstein’s gaze
Nicola’s most recent and breakthrough insight, however, relates to the computing of the repulsive forces. This was the only remaining time-consuming component of the algorithm. He perfected and implemented his insight during an internship at Google’s Zurich office. His peers in visual analytics are more than enthusiastic. One fan twitters about ‘new research from a clerk in our Bern office,’ thereby referring to Einstein, who developed his theory of special relativity during his time at the Swiss Patent Office in Bern. A comparison with Einstein is typically flawed, but there certainly are similarities between Nicola’s work and that of Einstein. “Point to point interaction is the standard way to see the t-SNE optimization problem,” Nicola explains. “You typically do not want to change the dominant paradigm. I decided to replace the point to point calculations for the repulsive force with the idea of a ‘field’.”
In Nicola’s approach, each data point in the 2D-representation projects a repulsive force onto a square piece of ‘space’, thereby creating a small field. Other data points that are in close enough proximity will experience a repulsive force because of this field, and vice versa. Instead of calculating all these forces between data points one by one, Nicola sums up all small fields into a global field in the two-dimensional space. At some locations these small fields may add up to a very strong global field, at other locations the global field may be much weaker or even be negligible. Subsequently, Nicola determines the repulsive force to each individual data point. This force depends only on the location of a data point within this global field. The field and the resultant forces are recomputed during each step in the optimization process. In its final implementation, the algorithm creates three global fields; for the horizontal repulsive forces, for the vertical repulsive forces, and a normalization field that ensures a smooth optimization.
“It may seem that my algorithm performs unnecessary computations as it calculates fields at locations where there are no data points. But the fields have a very low resolution and, more importantly, the approach is ideally suited for implementation on a graphical processor.” The square fields surrounding each data point (see figure) consist of two textured triangles. Graphical processors have been optimized to process such triangles at a very high speed. As a result, Nicola’s implementation of the t-SNE algorithm is about a hundred times faster than any previous implementation. A researcher can now observe the optimization process in real-time, even within a web browser, rather than having to wait tens of minutes to see the end result. “My implementation can handle much larger datasets, and the real-time visualization provides additional opportunities. A researcher can interrupt the optimization process at any moment to decide on additional training of the neural network, or to zoom in on a specific cluster for additional detail.”
Exploding complexity:
The original SNE algorithm computed forces between all data points.
- Having three data points, there are three forces to compute; between the points A-B, A-C and B-C.
- Having four data points, there are six forces to compute (A-B, A-C, A-D; B-C, B-D; C-D).
- Having ten data points, there are 45 forces to compute.
- Having N data points, there are (N∙(N-1))/2 = (N2-N)/2 forces to compute. The computational complexity scales with N2.
- Having (only) 10,000 data points, there are nearly fifty million forces to compute!
For an acceptable calculation time, even for large data sets, computer scientists try to find solutions that scale with N or, at most, with N∙log(N).
Replacing forces with a field is very similar to what Einstein did. He replaced the gravitational force – between planets, stars and other objects – with curved spacetime. In his theory, the gravitational force experienced by any object is a result of the local curvature in spacetime.
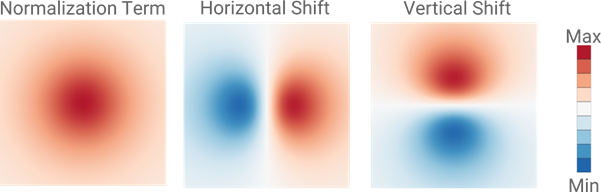
A magnified representation of the three fields that each data point projects. The data point would be in the center of the three images. In the two images on the right, a negative value (blue color) represents a repulsive force directed towards the left or downward.
Publicly available
Nicola’s algorithm has been incorporated into ‘Tensorflow.js’, Google’s open source software platform for – among other things – designing, training and analyzing neural networks. “It is important to me for software to be open source and readily usable by anyone. My software should not require a large computer infrastructure that only universities and companies can afford and maintain. I wanted my algorithm to be fast enough to be run on a single desktop computer.” Nicola also published his research in scientific journals, but even that doesn’t satisfy him. For someone who is not an expert, analyzing high-dimensional data still is a very difficult task. “I am lucky to be part of a research group that consists of many excellent and highly motivated computer scientists, each with their own specific interests.” His colleague Thomas Höllt is building a software platform, named Cytosplore, that bridges the gap between the algorithm and the biomedical researchers at the LUMC. “It is much more than a graphical user interface on top of some data processing routines. Thomas listens to their exact needs and creates a tool that allows them to independently enter and analyze their research data.” The applications of Nicola’s work are, however, not limited to neural networks and the biomedical field. A master’s student used his algorithm to analyze baseball player statistics. Nicola himself applied it to analyze social media filter bubbles. All that is needed now, is an algorithm that clarifies my electricity bill.
The movie shows a real-time optimization of the MNIST data set by the t-SNE algorithm. This data set consists of sixty thousand digitized handwritten numerals, from 0 to 9. The top-left panel shows the two-dimensional representation of this high-dimensional data set, with the numerals color-coded. The two bottom panels show the global fields for the repulsive force. The algorithm uses these fields to determine the repulsive forces in the horizontal and vertical directions. The top-right panel shows the normalization field. At the beginning of the optimization, the algorithm forces all data points into close proximity. This allows the attractive forces between similar data points to drive the process of clustering.
Click here to read the Portraits-of-Science contribution of Nicola Pezzotti