Infected IoT Devices
Trends, types and manufacturers
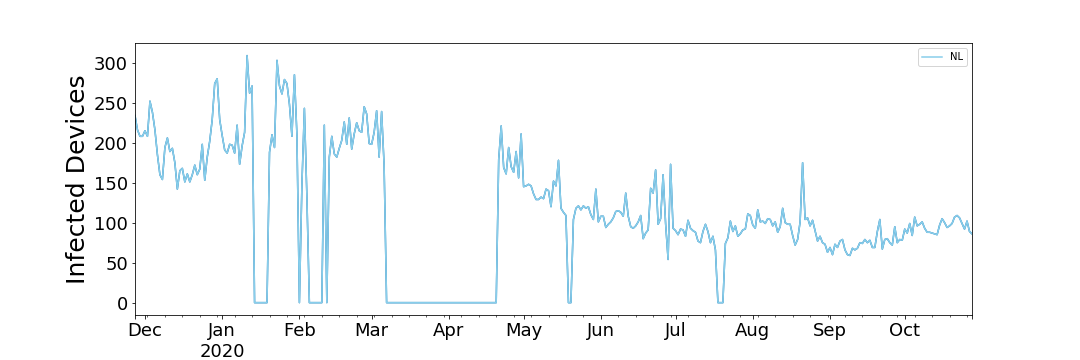
Since its deployment in 2019, the monitor has captured more than 30,000 infected IoT devices within Dutch networks. However, these infections are not all static; that is, some devices get remediated while new devices get infected. Even though the total number of infected devices in the last 13 months is of the order of tens of thousands, the average number of infected IoT devices is about 123 per day. This number of infections in the Netherlands is quite low compared to other European countries, and only around 1 ‰ Internet users is infected.
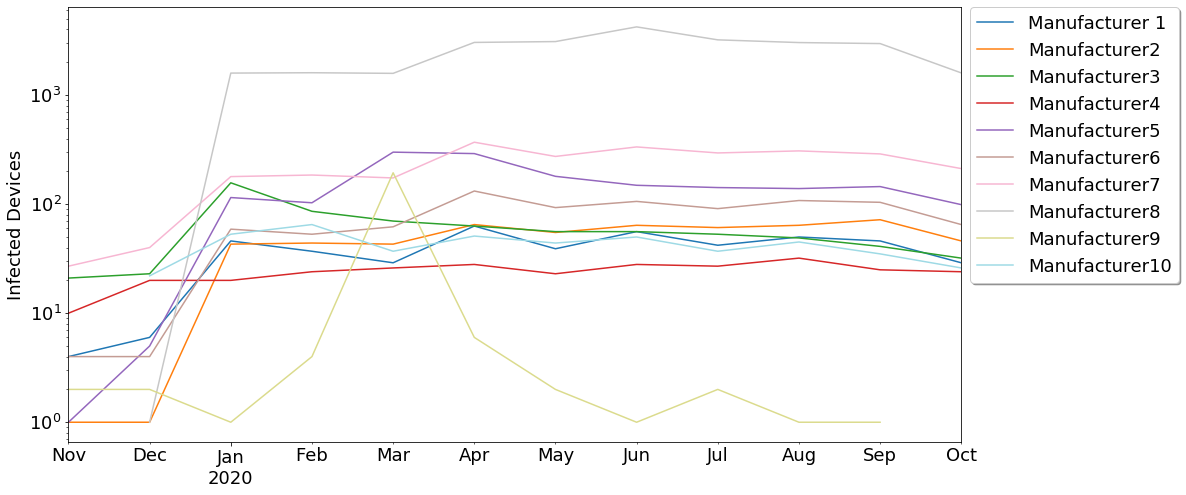
The monitor has identified multiple types of devices getting infected, being Network Attached Storage units and IP cameras the most commonly infected device types. Since the end of December 2019, a single manufacturer is responsible for more than 80% of the infections in the Netherlands (see Manufacturer 10 in the figure). Other device manufacturers, that drive IoT infections worldwide, represent less than 10% of the total number of infections the Netherlands.
So far the data captured by the monitor demonstrates that the number of infected devices in the Netherlands is not as critical as media reports have claimed. Nevertheless, the monitor has already shown that the landscape of infections is really volatile and the appearance of a new exploits can dramatically increase the number of infections suddenly. The pervasive presence of vulnerabilities in IoT products give attackers a myriad of possibilities to infect devices ad libitum.
Netherlands vs other countries
During the monitoring period, we detected an average daily infections of 123 infected IoT devices in The Netherlands. We calculate the average daily infection during the period to take into account DHCP churn, in the case of the Netherlands, we haven’t seen major IPv4 reassigning. However, to make a fair comparison with other countries this metric is more accurate estimation of the numbers. However, the numbers are not that low in countries such as Egypt which average daily infections are 37,085 and China which average daily infections are 13,554, and so on.
Country | #Infected IoT (daily mean) |
Egypt | 37,085 |
China | 13,554 |
India | 8,468 |
Brazil | 6,314 |
Taiwan | 6,193 |
Algeria | 4,990 |
Iran | 4,966 |
Vietnam | 4,094 |
Korea | 3,567 |
Hongkong | 3,019 |
Netherlands | 123 |
To provide a fairer comparison of the NL with similar countries, we provide the average daily infected IoT devices for G12 countries. As can be seen in the table, the Netherlands is the 3rd country with the least number of infection within G12, just behind Switzerland and Japan. Of course this absolute numbers should be normalized by the amount of internet users to have a better indication.
Country | #Infected IoT (daily mean) | Internet Users (per 1000) | Infection ratio |
Sweden | ˙1,087 | 8,398 | 0.13 |
Italy | 2,689 | 29,235 | 0.09 |
Germany | 2,122 | 65,125 | 0.03 |
Australia | 408 | 15,810 | 0.03 |
Spain | 714 | 28,119 | 0.03 |
France | 1,098 | 44,625 | 0.02 |
Canada | 615 | 26,960 | 0.02 |
USA | 2,661 | 245 | 0.01 |
Belgium | 75 | 8,113 | 0.01 |
Netherlands | 123 | 14,872 | 0.01 |
Japan | 520 | 99,182 | 0.01 |
Switzerland | 21 | 6,152 | 0.00 |