Visual analytics for sailing
Themes: Software technology & intelligent systems, Social Impact

A TRL is a measure to indicate the matureness of a developing technology. When an innovative idea is discovered it is often not directly suitable for application. Usually such novel idea is subjected to further experimentation, testing and prototyping before it can be implemented. The image below shows how to read TRL’s to categorise the innovative ideas.
Click to enlarge

Summary of the project
The research field of visual analytics brings together techniques and methodologies from computer science, data analysis, visual perception, interactive and graphic design. Through this convergence the aim is to develop novel and innovative visual means to facilitate the interaction and interpretation of complex and heterogenous data with the user using the capabilities of the human visual system. The researchers are building a dashboard, applying visual analytics strategies, which can assist coaches to improve the performance of sailors.
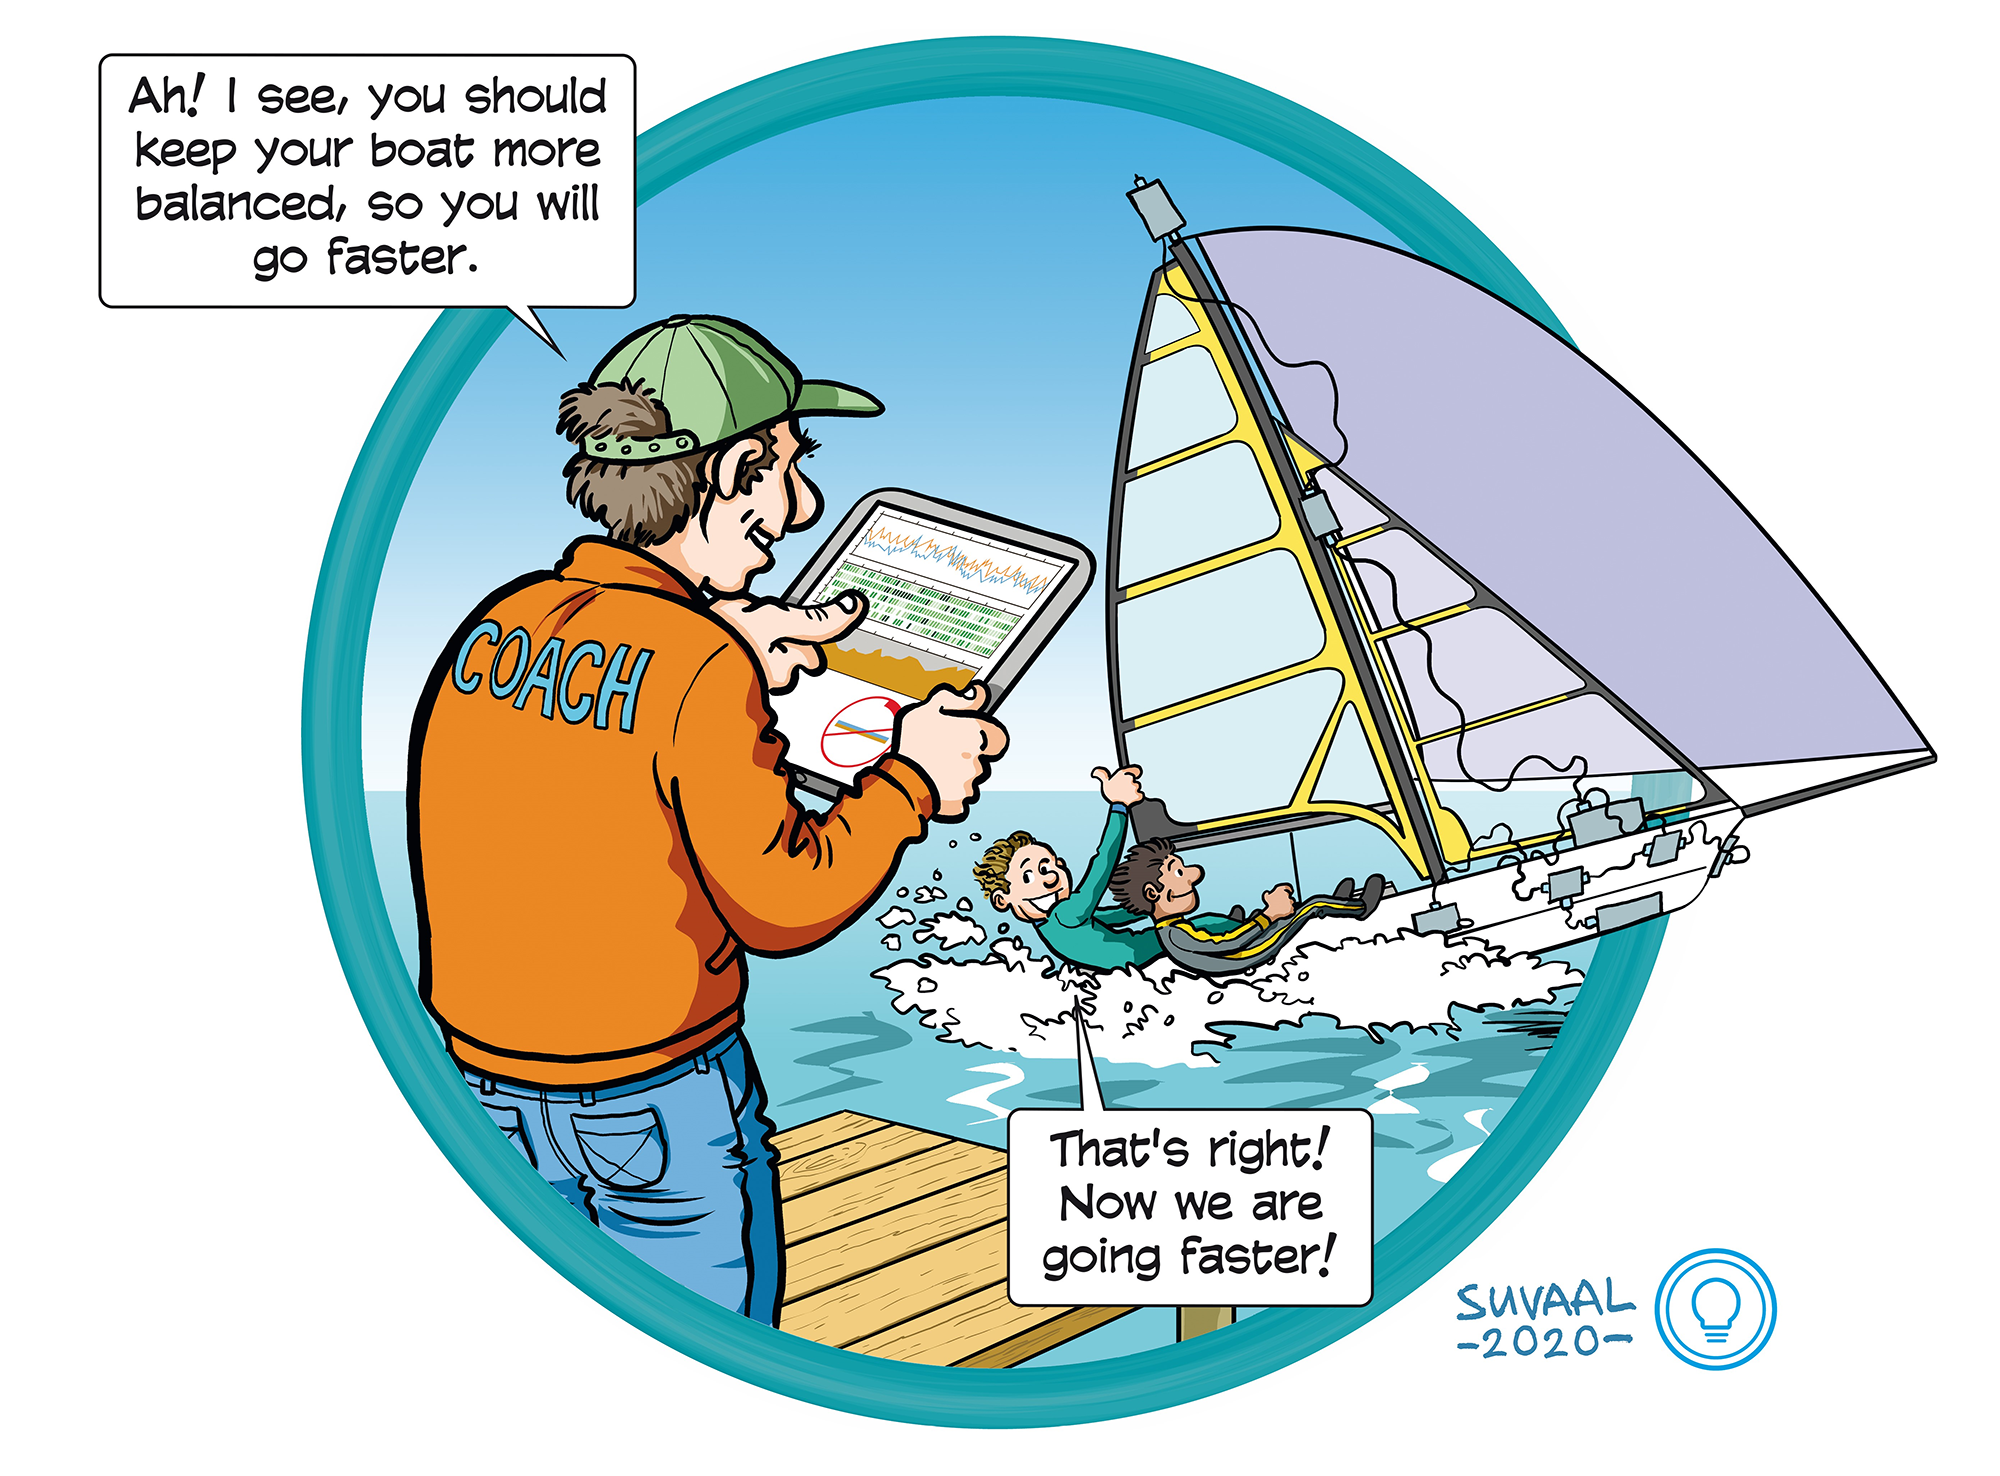
Often, feedback to the sailor is given based on simple data such as observations with the naked eye and measures by stopwatch which can make it difficult to understand why one performance was better than the other. With more sophisticated sensors available more data can be gathered during sailing practise runs by putting sensors on the boat, on the sails, the sailor but also including the weather and water parameters or a video information of the run. The complexity of the data makes it difficult to analyse directly looking at its raw numerical form. Through visual analytics solutions the coach can interactively explore complex data and get insight into multiple questions like why one run was more successful than the other and give instructions to the sailors accordingly.
An initial VA system, ComVis-Sail, has been created to analyse and compare specific sailing exercise based on sensor on the boat. In this exercise called Line-up, two boats sail side-by-side in straight line, with this strategy external information like wind and current affect the boats in equal manner so it can be neglected. In this setup coaches try to understand which boat configuration makes one boat faster than the other? With a dashboard, a comparison of the temporal data produced for multiple sensors attached to boats is carried out so coaches can generate hypothesis on what causes one boat perform better than the other.
What's next?
The next step for this innovative idea is to extend current visual analytics developments by including more complex data like weather or video information. On the other hand the researchers want to increase the complexity of the tackled problems with visual analytics techniques by adding more sources of information.
ir. Marcos Pieras Sagardoy
dr. ir. Anna Vilanova
dr. ir. Ricardo Marroquim
Prof. dr. ir. Elmar Eisemann
Douwe Broekens - Sailing Innovation Center
Sports Engineering Institute
European Regional Development Fund
Faculties involved
- EEMCS