Case 12: Citation networks (2)
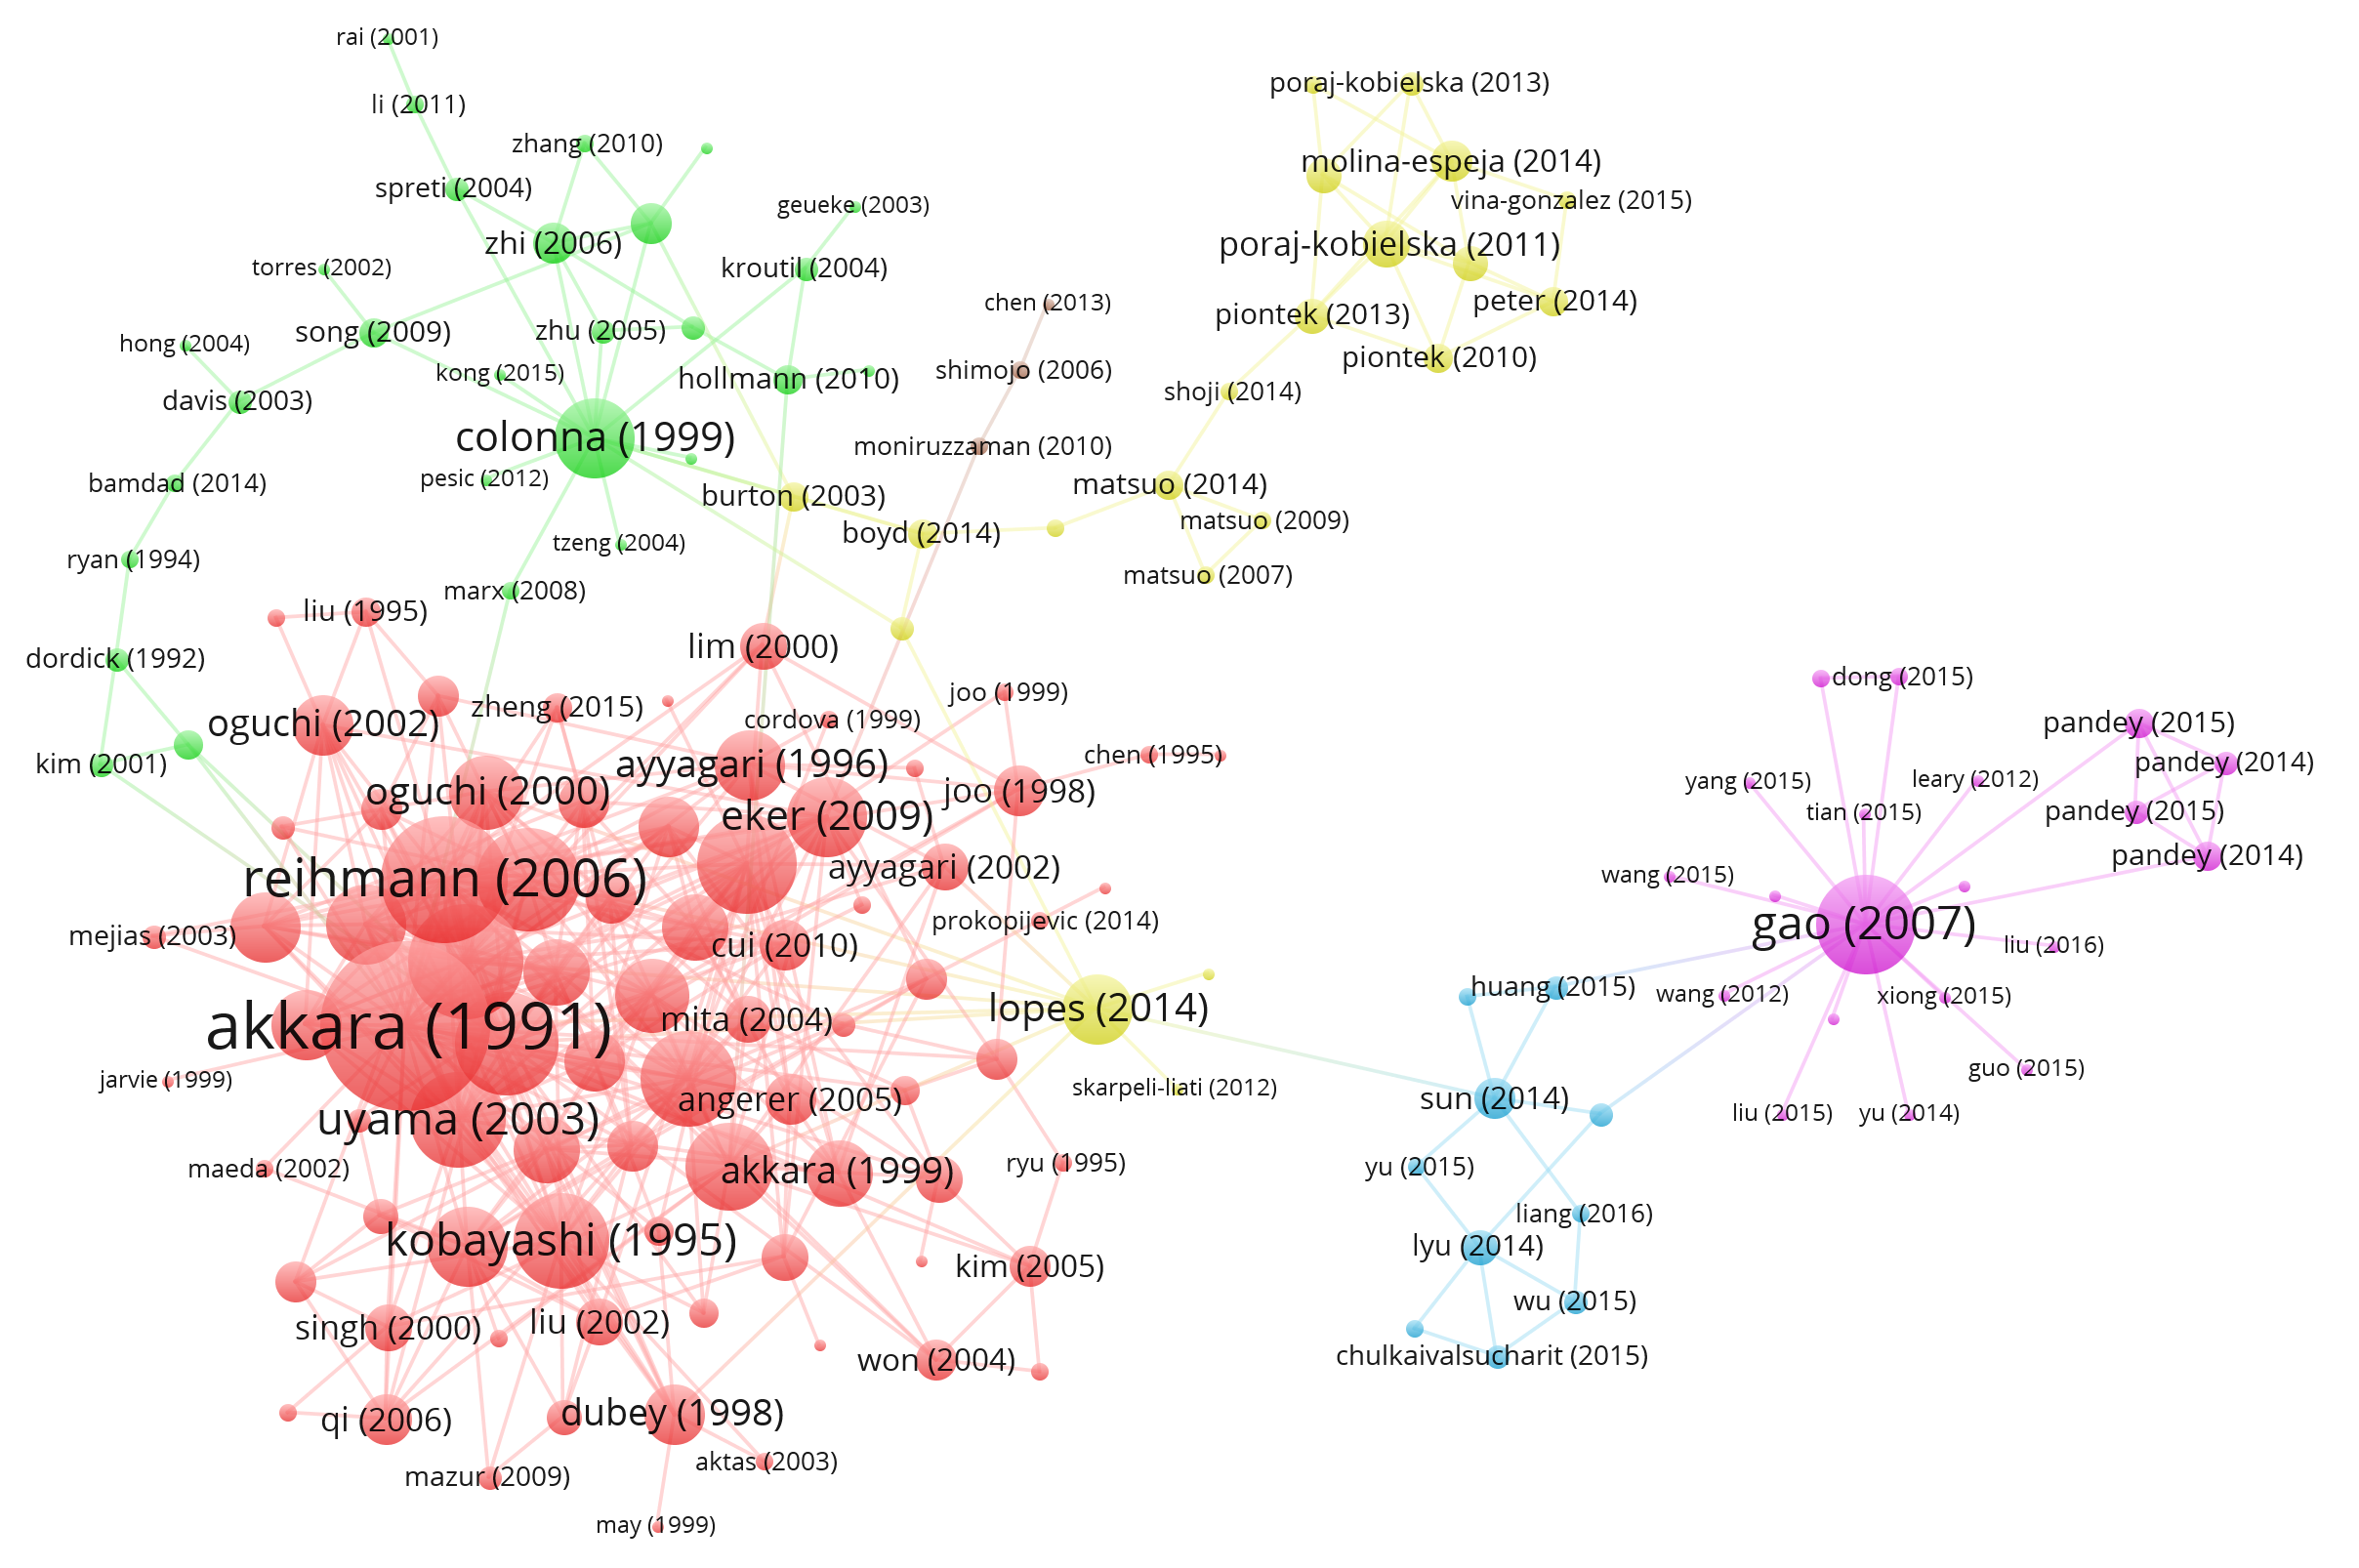
In this citation map, each circle corresponds to an important paper represented by the last name of first author and year of publication. The size of circles correspond to the number of times the paper has been cited. As can be seen, the colors of the map, assigned automatically, show different clusters of papers that have cited each other frequently.
What
depicts the citation network of a set of articles
Why
to detect the key publications that are cited frequently with other articles, and also allows for detection of articles that act as a bridge between different topics
Who
Phd Candidates, researchers and group leaders
How
1. collect your data from an appropriate data source
2. import the data into VOSviewer
3. generate the citation map based on bibliographic data
4. use the VOSviewer screenshot to export your map
Data
List of files:
data.txt
map.txt
net.txt
map_disconnected.txt
net_disconnected.txt
visualization_citation_2.png