Case 16: News overview
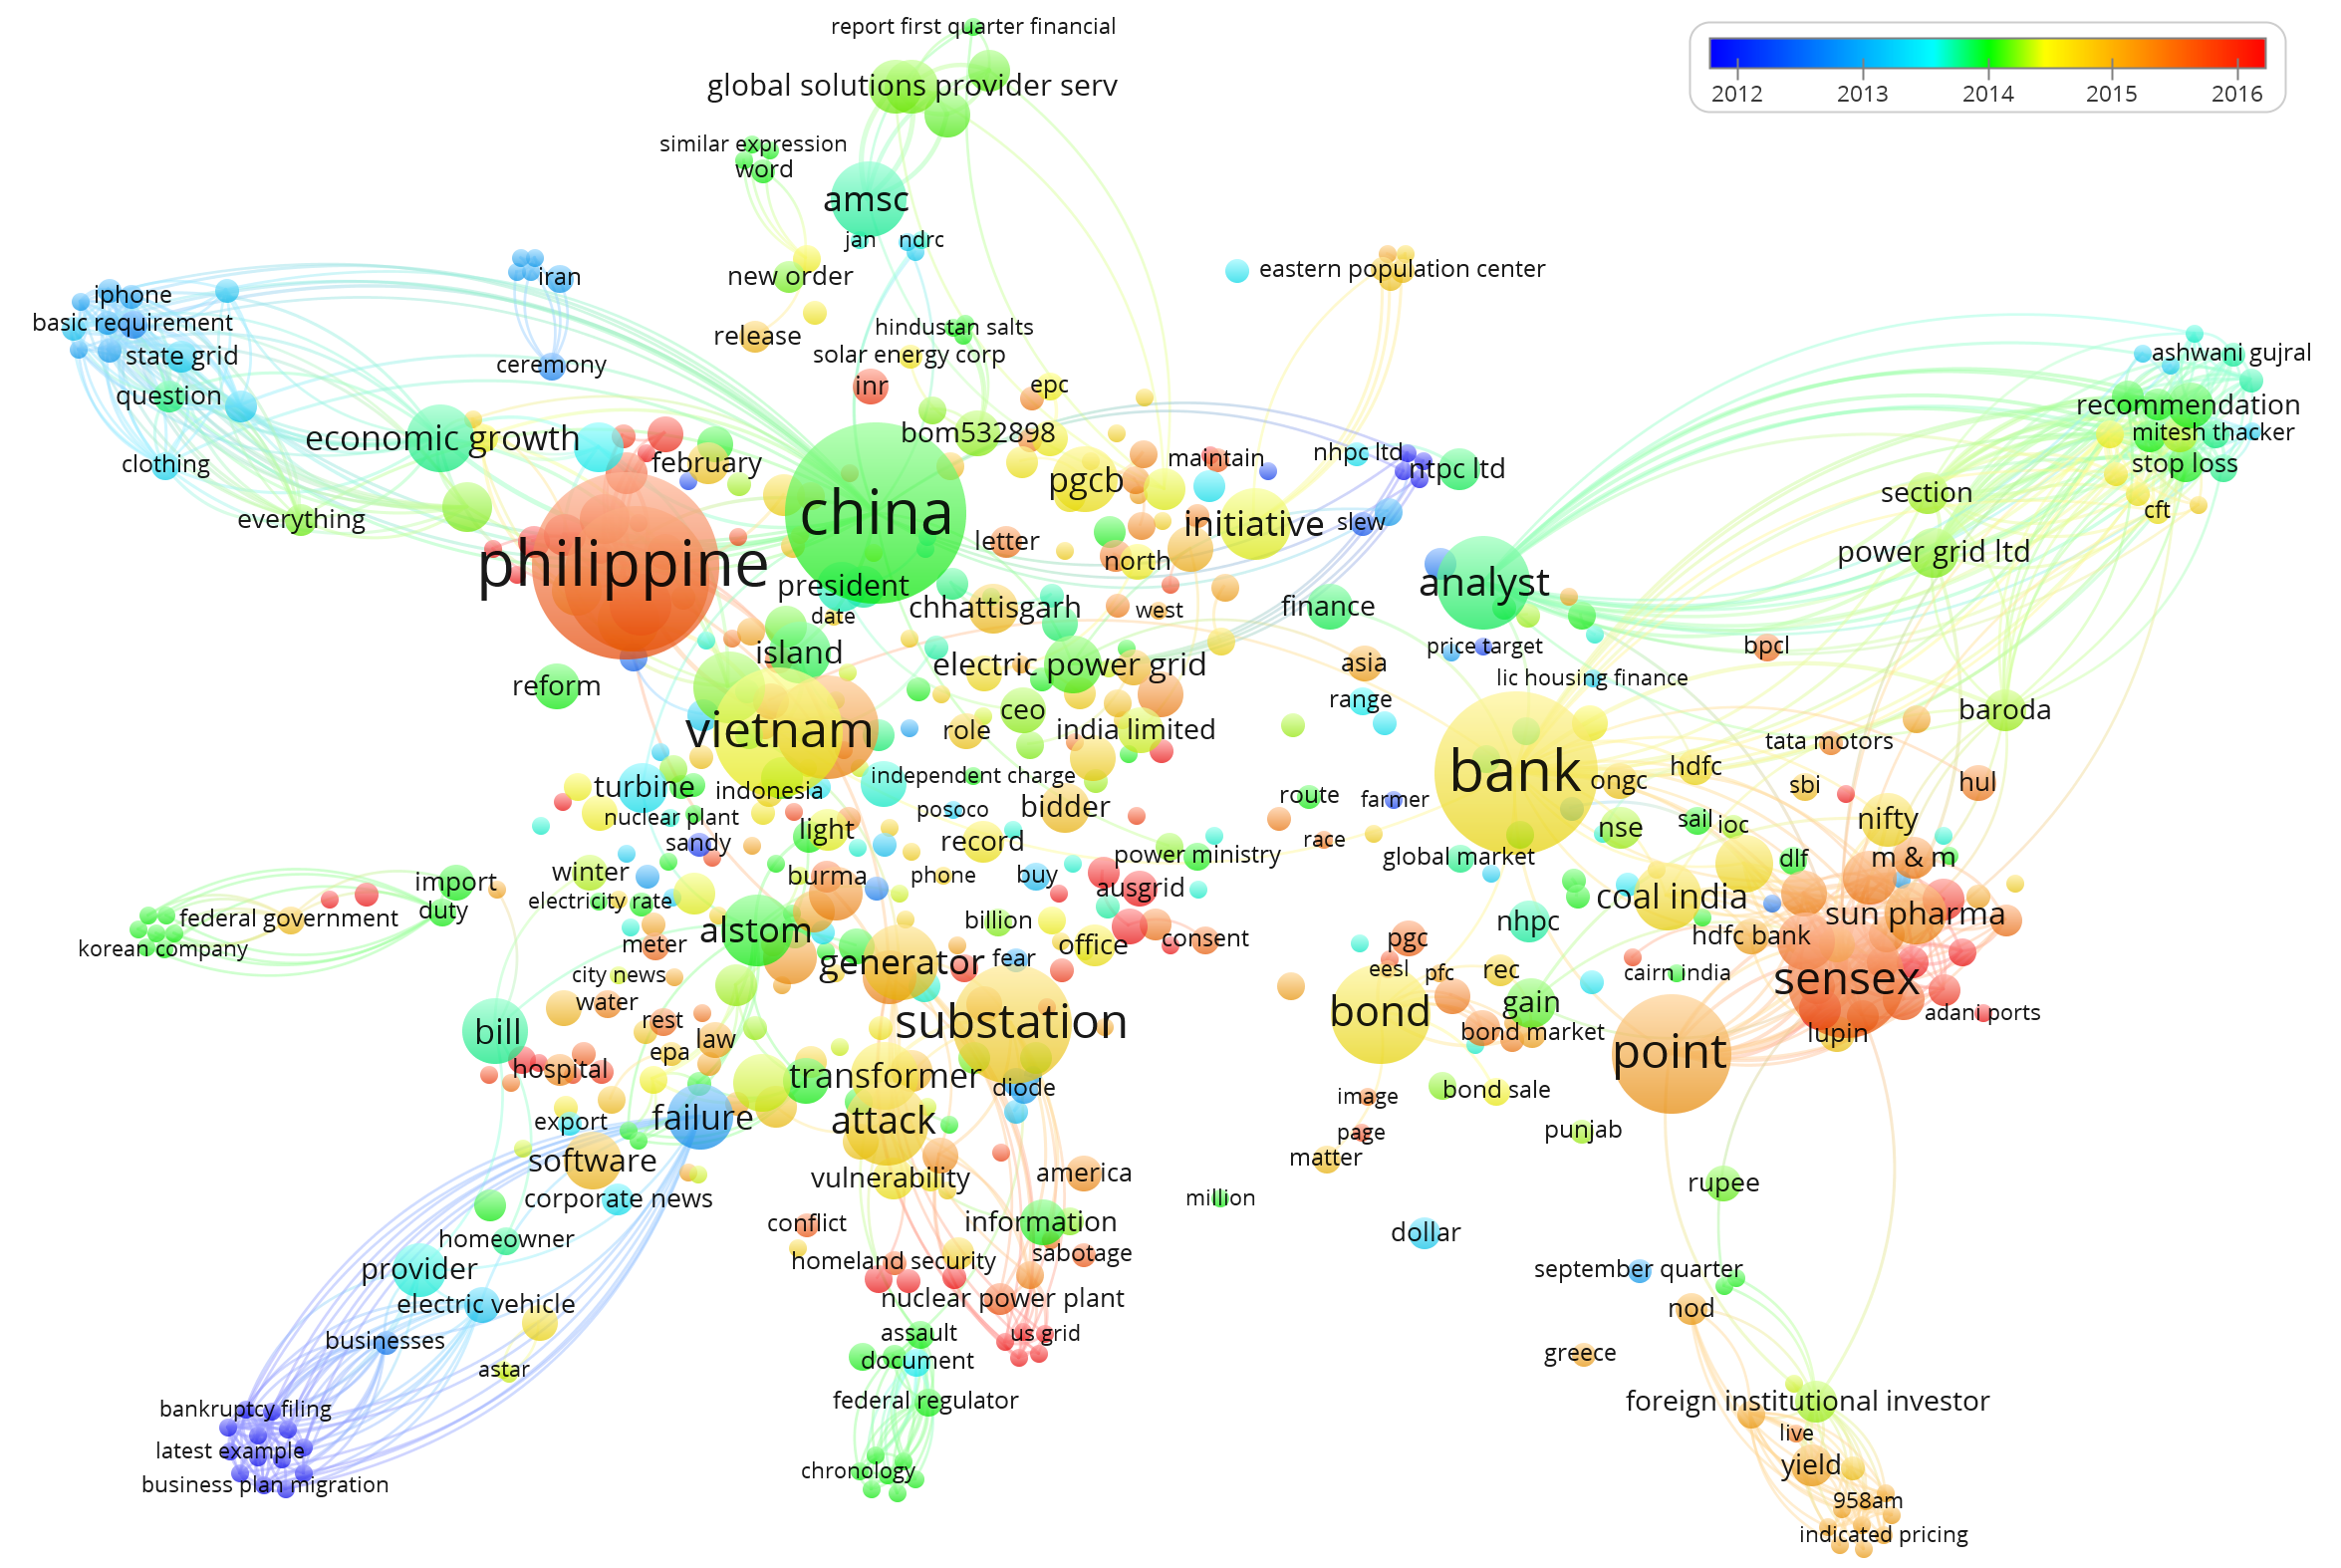
This term map visualizes different topics that are being covered by news articles published on the topic Power Grid. The color indicates the average year of publication of articles that include each term.
What
shows how frequently the articles of different researchers are cited together by the same articles
Why
to know the important topics discussed over news and to identify the existing patterns between these topics
Who
PhD candidates, researchers, group leaders and policy makers
How
1. run your query in the search.proquest.com website
2. export your results in RIS format
3. import the data into VOSviewer
4. generate the term map based on text data
5. use the overlay visualization feature to color the circles with the average publication year corresponding to the terms
6. use the VOSviewer screenshot to export your map