
CityAccessMap: Addressing urban inequalities with open-source data
People in deprived city areas tend to have less services available than inhabitants in wealthier parts. They have less access to urban infrastructure such as pharmacies, libraries, sports clubs and even public transport in their neighbourhood. Reversing this tendency is a priority for today’s policy-makers. Researchers of TU Delft have created a new online tool ‘CityAccessMap’ that can help them in doing so.
CityAccessMap measures and visualises the accessibility to urban infrastructure of several cities worldwide. The tool is available to anyone who would like to see how urban infrastructure is distributed, but is especially of interest to urban planners. “With the tool we want to create awareness among policymakers and spur them to action to do something about inequalities for certain underprivileged communities”, says researcher Trivik Verma, assistant professor in urban science and policy who is involved in the development of the online tool. Together with his team, their research into accessibility and socio-economic aspects of people’s well-being shows that disadvantaged communities have lower access. It provides a framework for assessing the distribution of urban infrastructure, identifying areas where it is important to improve services.
Measuring quality of life
Today, the quality of life of urban environments is often measured in terms of accessibility: that is, the ability of urban residents to benefit from different services and opportunities. To design planning interventions for essential services being distributed in a fair and equitable manner, city planners must first assess existing levels of accessibility in their city. With the objective to drastically simplify this task, Verma and fellow researchers Leonardo Nicoletti, Mikhail Sirenko have created a new web-application ‘CityAccessMap’ that visualises urban accessibility insights for almost every city in the world (i.e., any city that is home to at least 100,000 inhabitants).
CityAccessMap
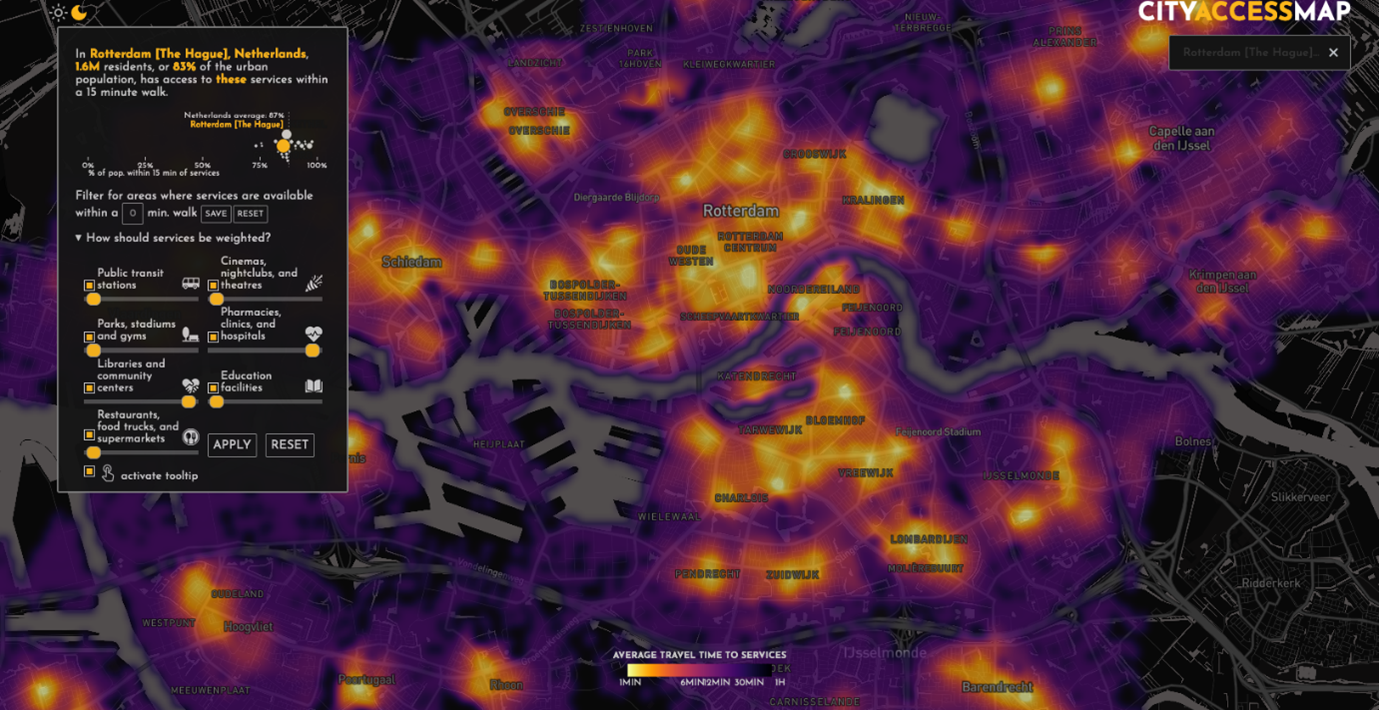
The web-app CityAccessMap uses open geographic data from OpenStreetMap and publicly available population grids of the European Commission’s Global Human Settlement Layer (GHSL). “Planners can use the app to see how accessibility to different facilities is distributed across their city and its population”, says Nicoletti, the architect behind the development of CityAccessMap.
Verma: “For instance, in Rotterdam, there are so many city parts that offer lower levels of access to certain communities (see image), compared to the rest of the region. By using CityAccessMap, policymakers can get a better picture of accessibility, whether they have succeeded in improving accessibility in neighbourhoods and where more collective action towards reducing inequalities is still needed. "Looking at these insights, decision-makers can ultimately better understand how close they are to achieving better outcomes for accessibility for their communities locally or foster more collective action towards reducing inequalities.
Improving levels of accessibility for certain communities can provide them with upward social mobility and address social exclusion and inequalities in cities. “This is why it is important to understand the nature and distribution of spatial accessibility among urban communities”, stresses Verma. “And addressing spatial inequalities through data analysis should not only be feasible for well-funded metropolitan authorities like Paris or New York City, it should be possible for any planning department, no matter what their resources are”, adds Nicoletti. CityAccessMap now gives them the ability to do so. Visit the site of CityAccessMap.
More information
For more information about CityAccessMap you can contact:
- Karlijn Spoor, press officer Resilient Cities & Mobility | TU Delft – K.Spoor@tudelft.nl/ 0031 641612272
- Trivik Verma, assistant professor at the faculty of Technology, Policy and Management TU Delft – t.verma@tudelft.nl
- Leonardo Nicoletti, developer/designer of CityAccessMap app and former researcher at the faculty of Technology, Policy and Management www.leonardonicoletti.com
Read more about the research and background of CityAccessMap in the recently published paper in the prestigious urban planning journal: Environment and Planning, B.
Researchers

Trivik Verma
