VARSYS

Vulnerability Assessment for Railway Networks (VARSYS)
The Vulnerability Assessment for Railway Networks (VARSYS) is a tool for assessing critical links in a railway network regarding operational adaptations of railway services and the resulting passenger reactions. The criticality is defined as the highest negative impact on passengers travelling in the network. The tool incorporates two main functions: the identification of critical combinations of links in the network (Critical Link Assessment) and the assessment of the impact of particular disrupted links in the network (Network Assessment). These two functions allow the user to assess the network performance and compare multiple disruption scenarios. VARSYS can be used for providing the railway planner insights into the vulnerability of the underlying network structure and the planned operations. Consequently, it can be used as a supporting tool for creating timetables which are less vulnerable to disruptions and hence more attractive for passengers even in the case of disruptions.
VARSYS core. The core of the tool is the Railway Network Vulnerability Model (RNVM) (Szymula and Besinovic, 2019), which uses a mathematical linear programming for identifying the critical links in the given railway transport system combining infrastructure network, train services and passenger flows. The RNVM uses a passenger-centered vulnerability measure capturing passenger detours and disconnected passenger connections. For modelling passenger behaviour realistically, the railway services are adapted to accommodate for the disrupted network and generating alternative passenger paths while some passenger paths become completely unavailable. As a result, the RNVM does not only compute the critical combination of links but also the adjusted timetable and the adapted passenger flows throughout the network.
Critical Link Assessment. The Critical Link Assessment allows the user to identify the critical combination of links in the network. For finding the solution, the tool requires the number of links to be disrupted, the setting of a passenger detour parameter and the selection of trains that can be rerouted.
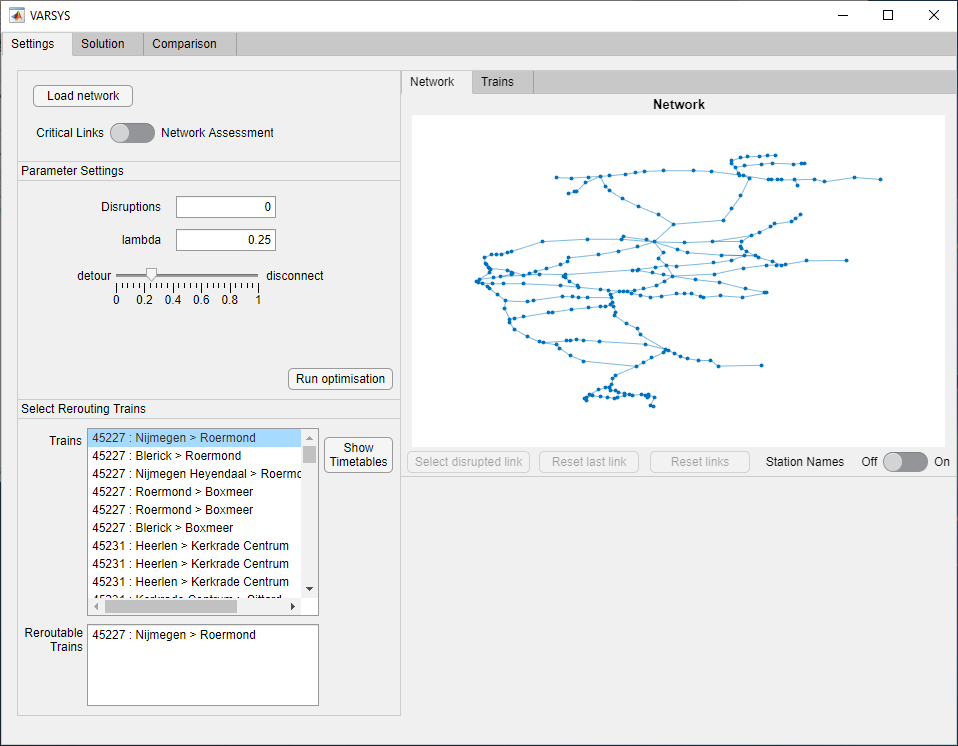
Critical Link Assessment -- Input
The tool gives the following resulting outputs: the value of the objective function, the number of transported and disconnected passengers, the total passenger travel time in the network and the number of short-turned trains. It graphically displays the critical links in the network, the resulting passenger flows and the train routes. Additionally, the resulting timetables can be inspected for each train or per selected network corridor.
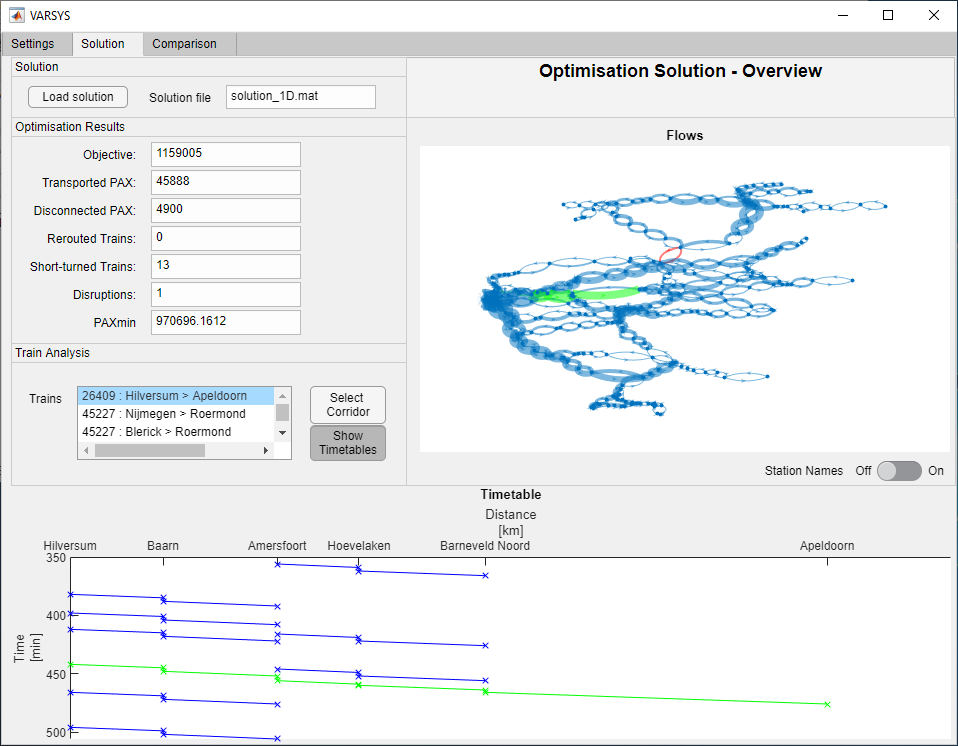
Critical Link Assessment -- Passenger Flows with Timetables
Network Assessment. The Network Assessment allows the user to manually select the combination of links to be evaluated. Hence, it takes the passenger detour parameter and the trains considered for rerouting. The tool gives the same outputs as in the Critical Links Assessment, allowing for a detailed evaluation of various disruption scenarios of interest.
Solution Comparison. For comparing different solutions, the tool allows to analyse two precomputed solutions. In particular, the tool displays the corresponding deviations of the objective function value, the number of transported and disconnected passengers, the total passenger travel time, the number of rerouted trains and the number of disruptions. Additionally, the disrupted links of the assessed solutions as well as the differences in passenger flows and timetables are displayed.
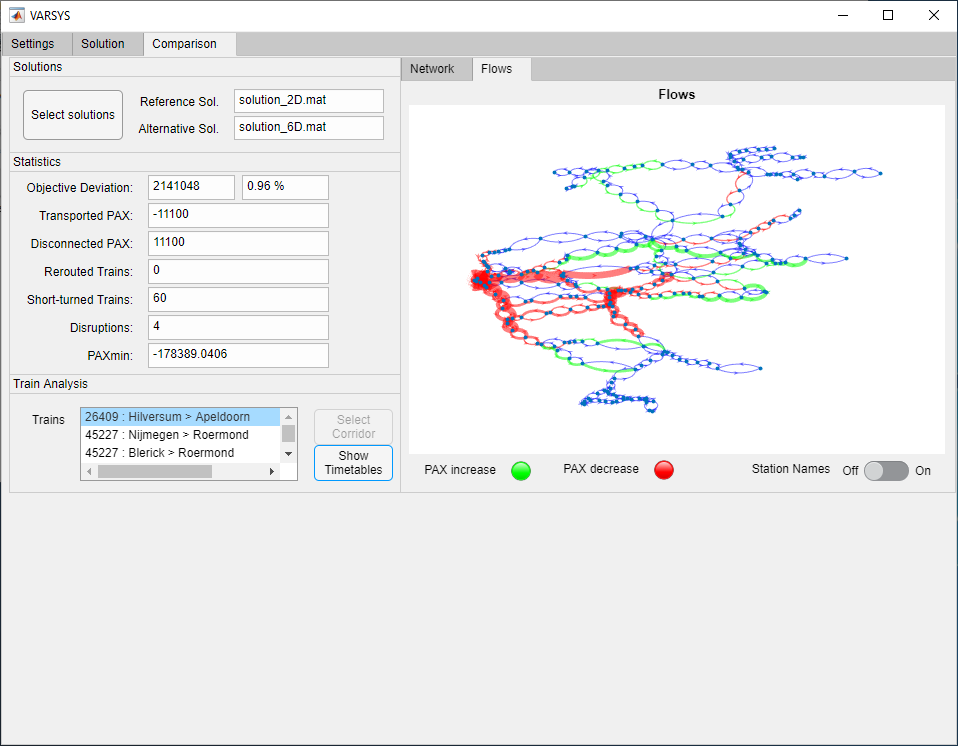
Solution Comparison -- Passenger Flows
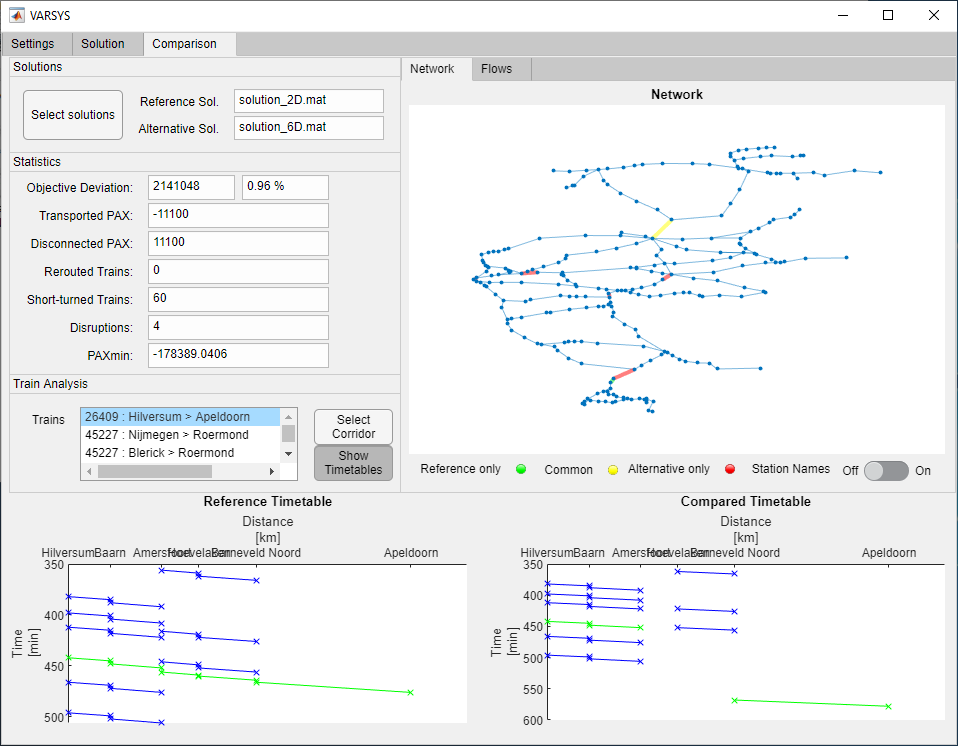
Solution Comparison -- Network with Timetables
Reference:
Christopher Szymula, Nikola Bešinović, Passenger-centered vulnerability assessment of railway networks. Manuscript submitted for journal publication.