STAFER

Railway planning toolbox STAFER (Scheduling for Today’s Advanced, Flexible and Effective Railways).
STAFER is a railway planning toolbox for designing and evaluating railway timetables. STAFER incorporates two main tools: Micro-macro timetabling for designing improved railway timetables and RobEval for evaluating timetable robustness. The modular structure of STAFER allows alternative optimization and evaluation algorithms and further planning steps to be easily added.
Micro-macro timetabling tool. The core of the Micro-macro timetabling tool is the performance-based framework The tool integrates microscopic models for computing running and headway times and evaluating timetable feasibility and stability.
Input includes selection of timetable design parameters, minimum and maximum running time rates, minimum buffer time, and a preferable objective function. Objective functions can be minimizing efficiency (i.e., train journey times), maximizing robustness (i.e., total buffer between train events) or a combination of both.
Graphical output consists of three types of diagrams: the time-distance diagram for a selected corridor, the corresponding blocking time diagram and the computed minimum and operational speed profiles for the selected line are shown. By analysing these diagrams, you could assure that a designed timetable includes acceptable speed profiles and is conflict-free. In addition, the tool produces the number of iterations needed to design a feasible, stable and robust solution.
Statistics report the characteristic values for scheduled running time supplements and train journey times over all lines.
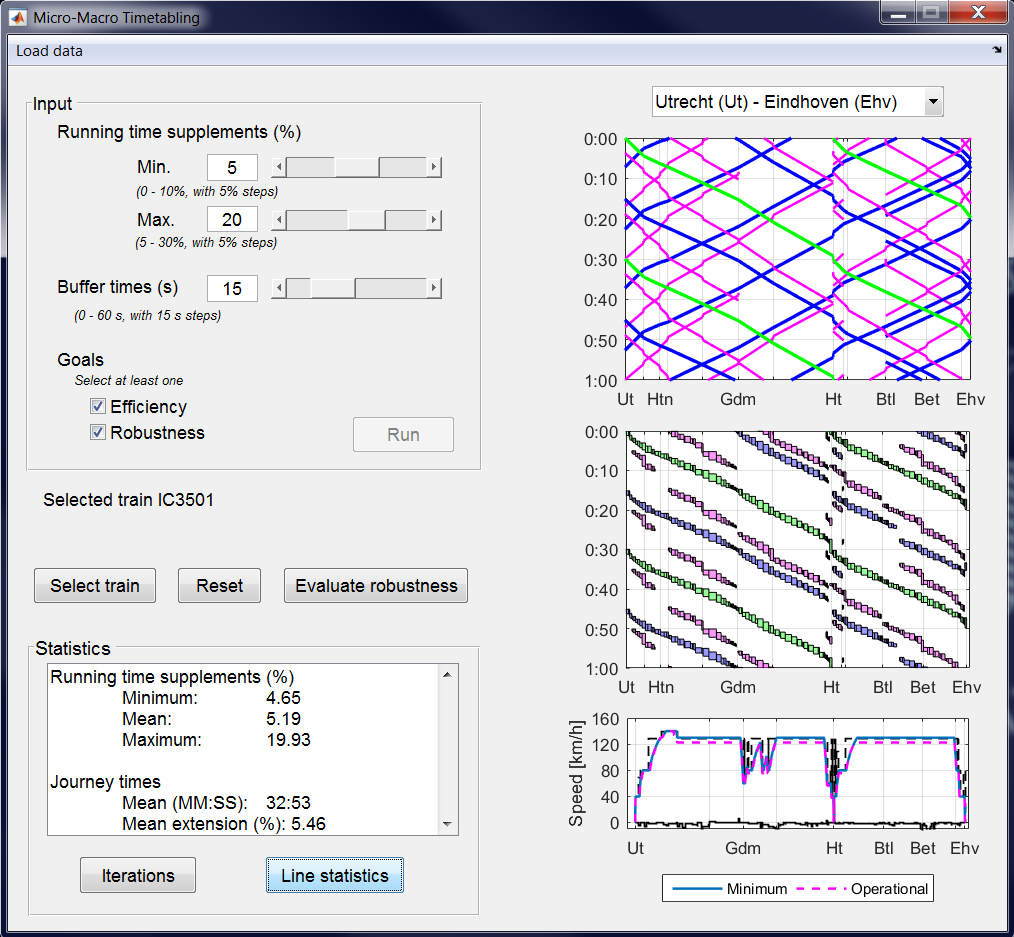
Graphical interface of Micro-Macro timetabling tool
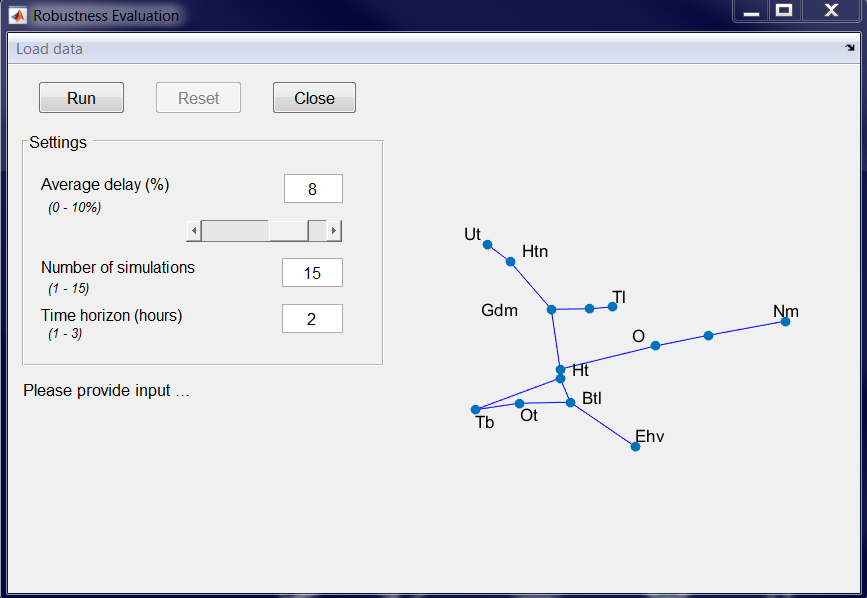
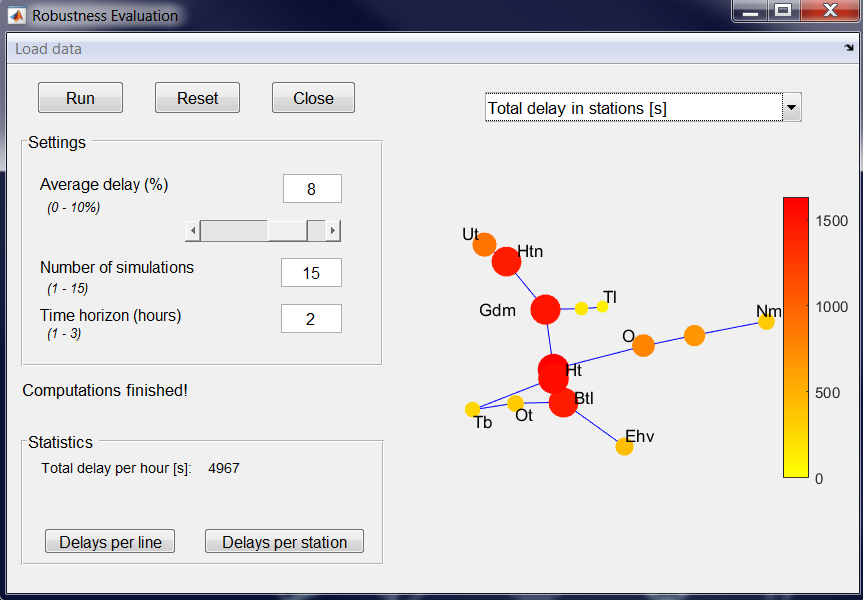
Graphical interface of robustness evaluation tool
Robustness evaluation tool. The robustness evaluation tool RobEval integrates the delay propagation model. The input timetable to RobEval can be loaded within the GUI or generated by the Micro-macro timetabling tool.
Input provides defining an average input delay, the number of simulations and the considered time horizon. Graphical output gives a selection of three plots: the time-distance diagram with all computed scenarios, the time-distance bandwidth diagram with the corresponding mean running times and network layout with visualised total delays in stations. Statistics report gives the total delay and detailed total delays per train line and per station.
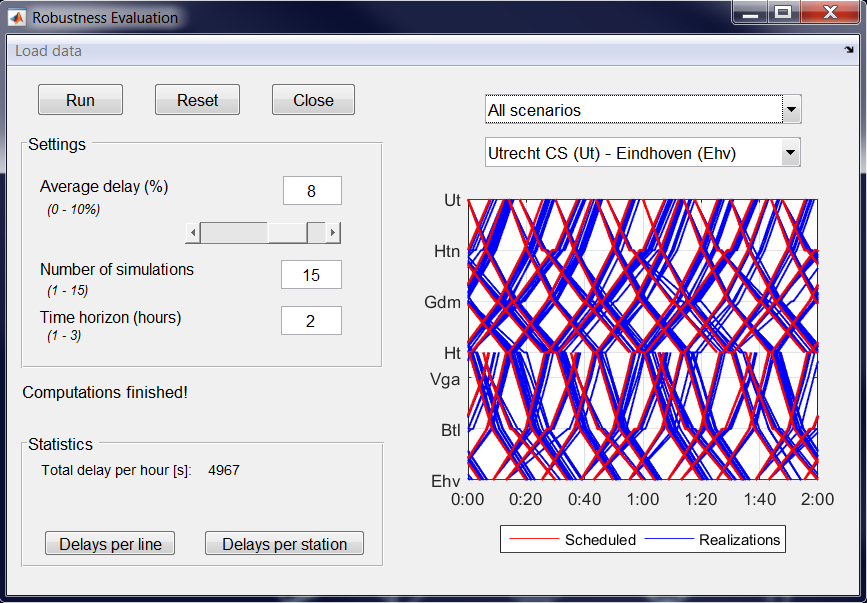
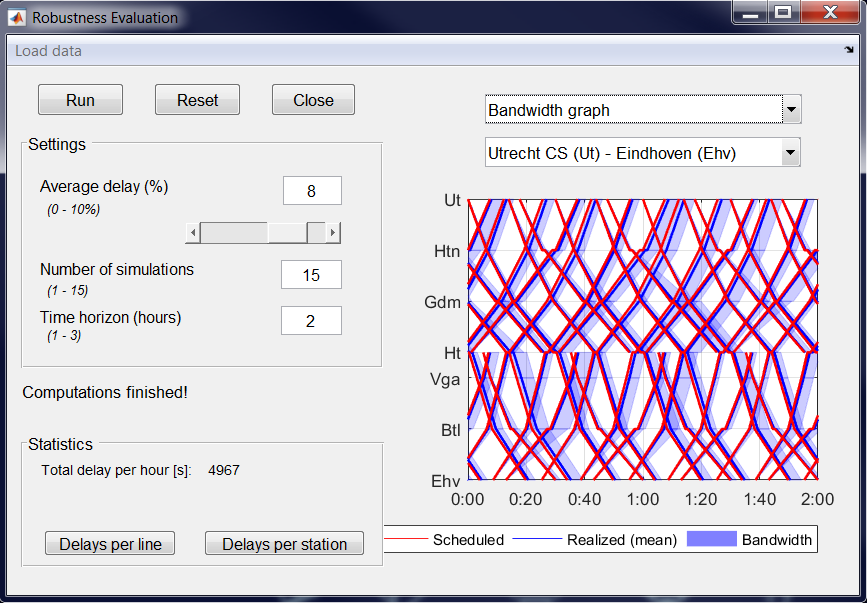
Graphical output of robustness evaluation tool
People involved
Dr. Nikola Bešinović
Prof.dr. Rob Goverde
Publications
-
Besinovic, N. (2017). Integrated capacity assessment and timetabling models for dense railway networks.
Partners