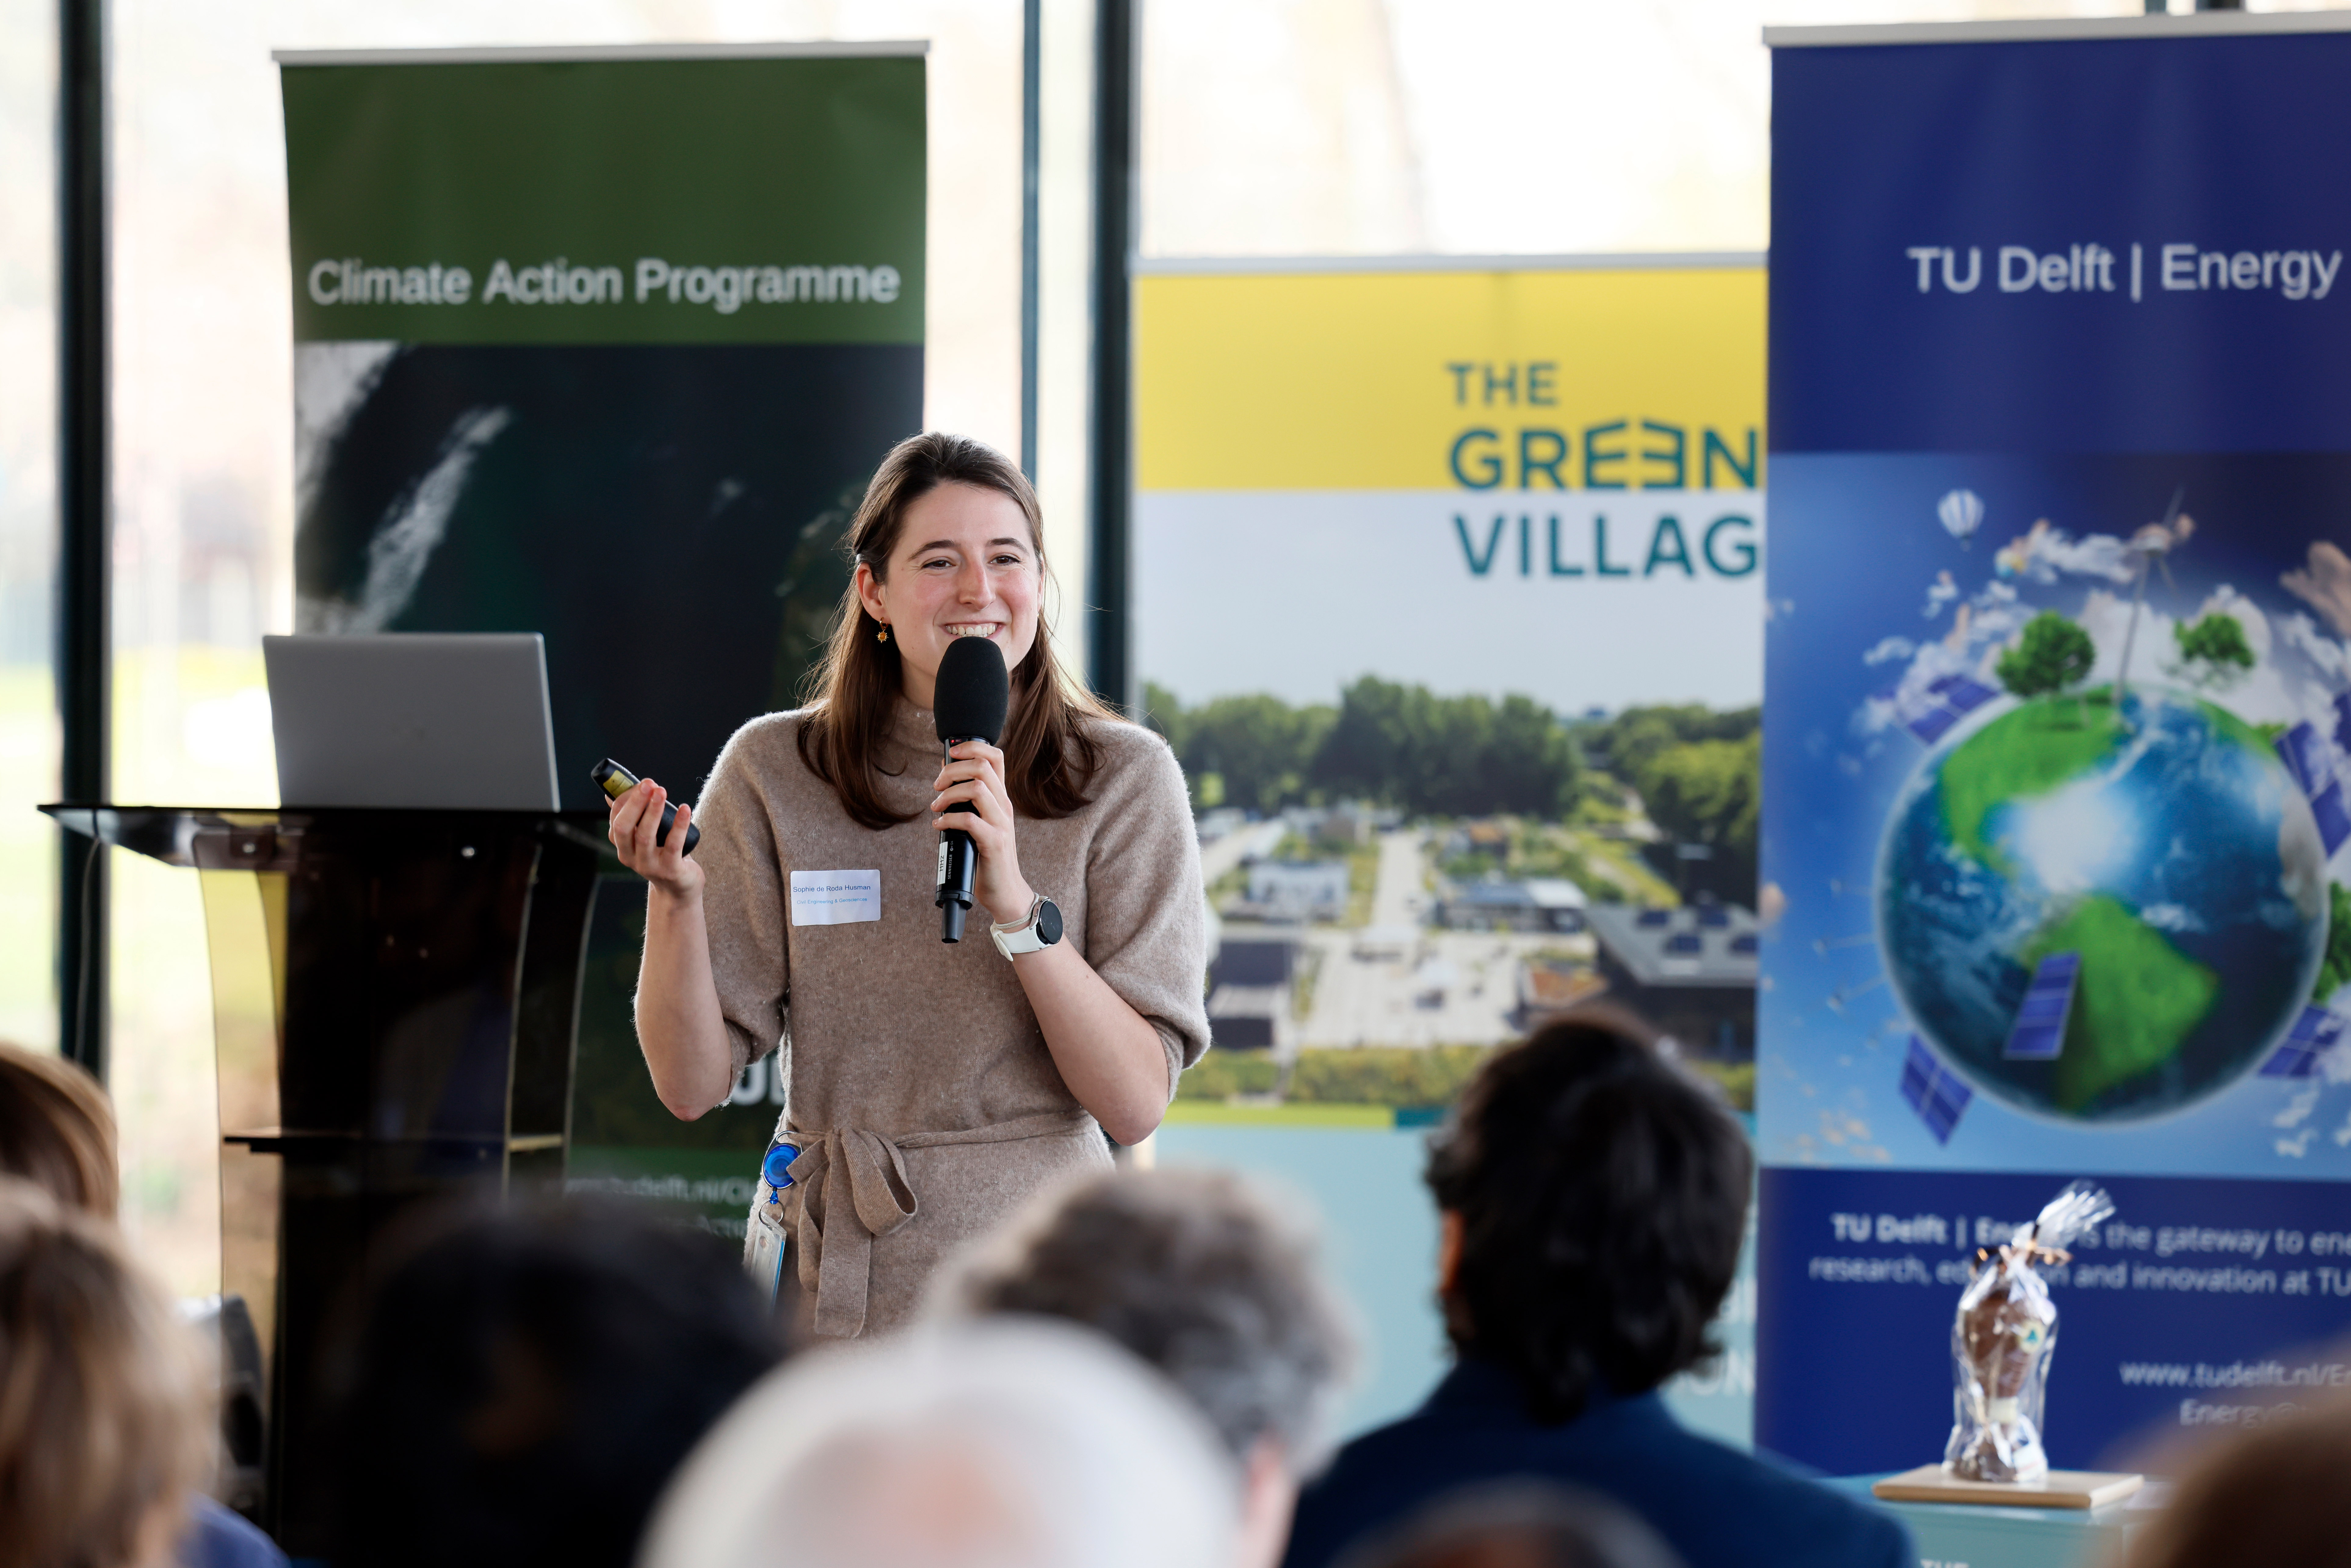
Antarctica has long been considered the “sleeping giant” of sea level rise. But thanks to global warming, it is poised to overtake Greenland as the main contributor. Sophie de Roda Husman combined satellite data to create a detailed historical surface melting record that may help reduce the sizable uncertainty in sea level rise estimates of current climate scenarios. It also won her the award for Best Climate Action paper.
Every now and then, the news focuses on huge icebergs breaking off from Antarctica. While also occurring in a climate system in equilibrium, these events are anticipated to happen more often due to global warming, thereby contributing to accelerated sea level rise. Atmospheric-driven surface melt will be an increasingly important contributor to such ice shelf retreat. It’s a cumulative effect of many very localised and brief melting events that tend to go unnoticed by satellites – leaving a knowledge gap when it comes to our understanding of the processes threatening Antarctica now and in the future.
Fascinated by a place on earth that we know so little of, yet is so important, Sophie de Roda Husman set out to fill that gap. ‘Sea level rise predictions for 2150 by the IPCC range from half a meter for a very low emission scenario up to 5 meters for a very high emission scenario,’ says the PhD candidate at the department of Geoscience & Remote Sensing. ‘But the uncertainties in these numbers can be several meters as well, mainly because a lack of knowledge makes it difficult to predict the future contribution of the Antarctic Ice Sheet. My goal is to help reduce that uncertainty.’
The uncertainty in projected sea level rise of up to several meters is mainly because of the uncertainty in the future contribution of the Antarctic Ice Sheet.
Too coarse or too infrequent
It’s not that there’s a lack of data as various satellite systems provide coverage of Antarctica. Either directly measuring the surface temperature, or roughness of the surface using radar, their data can be used as a proxy for surface melt. ‘The problem is that some of these systems cover the whole of Antarctica frequently, but they miss small-scale melting events because of their coarse spatial resolution,’ de Roda Husman says. ‘Other systems have a much more fine-grained resolution but a low revisit time of only a few times per week, thereby missing brief melting events.’
Matching overpasses
The good news is that various satellite systems have moments of matching overpasses, thereby providing both kinds of data for one and the same region at the same time. One such region is the Shackleton ice shelf, which experiences strong variations in melt patterns – making it an exemplar for all other Antarctic ice shelves. Using this overlapping data, de Roda Husman trained a machine learning algorithm for turning frequent, coarse satellite data into melt data that is both detailed in frequency and in spatial resolution. ‘I then validated this machine learning model on the Larsen C ice shelf, which also has matching overpasses.’
My machine learning algorithm turns coarse satellite data into melt data that is both detailed in frequency and comes at a fine spatial resolution.
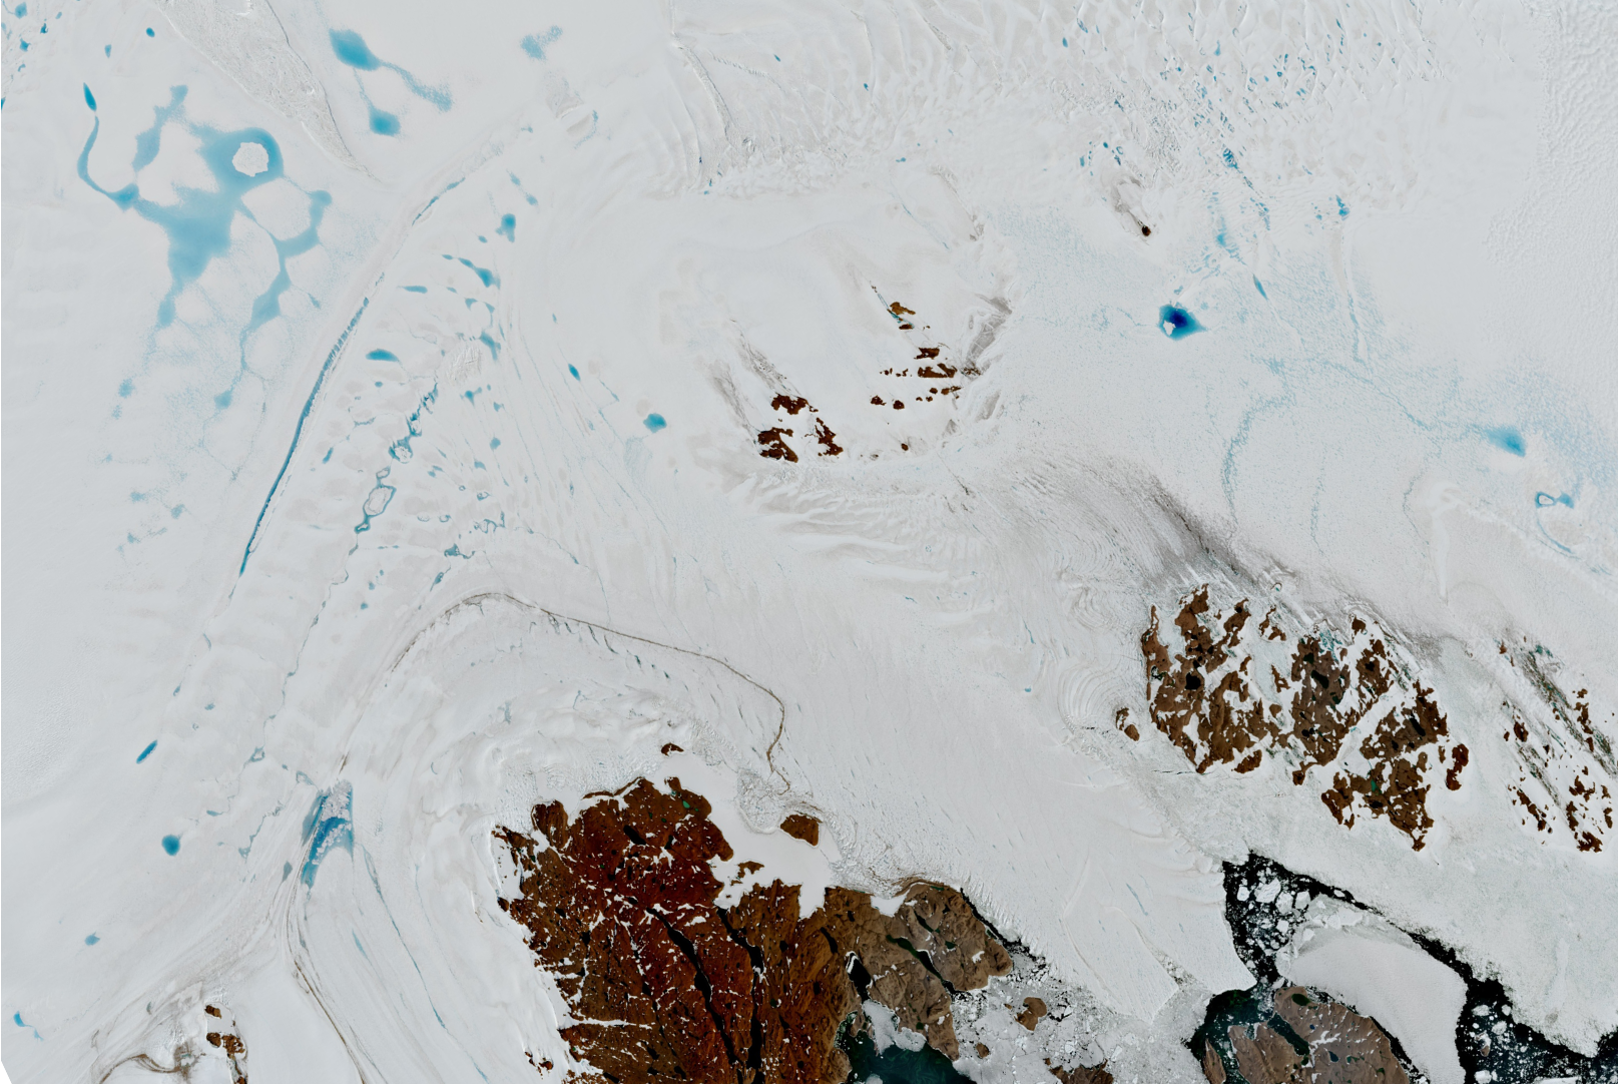
We’re able to see very detailed melting patterns, especially at the critical grounding zone where the land-based ice transitions into an ocean-based ice shelf.
She subsequently used historical satellite data to create UMelt: a high-resolution surface melt record of the Antarctic ice shelves covering the period 2016 – 2021. ‘It captures surface melt every 12 hours, with details down to 500m,’ De Roda Husman says. ‘A big improvement as coarse satellite data has a resolution of roughly 25 kilometres, which means that certain ice shelves were represented by only a few pixels.’
Analysing, interpreting, and managing the terabytes of data was a humongous task requiring cloud computing, and it was well worth the effort. ‘We now see very detailed melting patterns, especially at the critical grounding zone where the land-based ice sheets transition into ocean-based ice shelves.’ It won her the award for Best Climate Action paper.
Improving surface melting processes in climate models can help us make better predictions about sea level rise in the long run.
Refined climate models
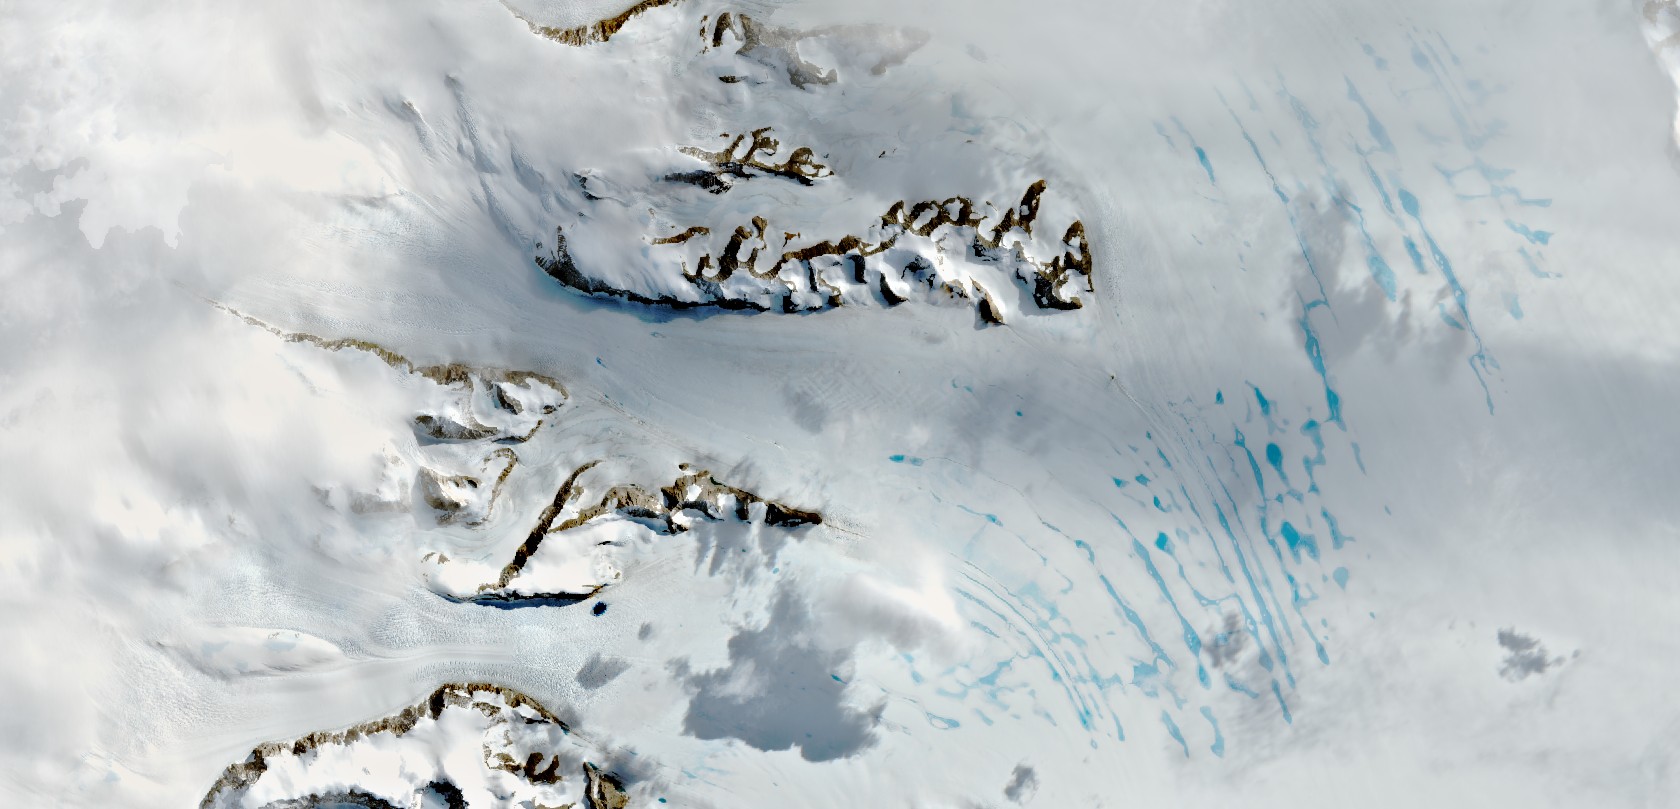
Currently, the main driver for ice shelf weakening still is ocean warming, causing the shelfs to melt from below, reducing their overall thickness. But this also increases the impact of lakes of meltwater. These can add a lot of pressure at one location and may also help fracture an ice shelf when draining through cracks. And with summer temperatures at the grounding line surpassing the zero degree melting point more frequently, this process is accelerating.
‘We expect that UMelt will help other scientists to refine the surface melting processes, bringing climate models more in line with real-world observations,’ De Roda Husman says. ‘This may ultimately enhance our projections of sea level rise.’ Asked if her method can also be applied to Greenland or the North Pole, she has a very decisive answer. ‘Certainly, but I will personally stick with Antarctica.’
Read Sophie's winning publication in its entirety here.
The Best Climate and Energy Paper Award 2023 Ceremony took place on Tuesday 19 March 2024. Curious about the other eight finalists? See the full press release sent out at the time here.
If you would like to interview one of the finalists, or learn more about Delft's climate and energy ambitions, please feel free to contact:
• Dave Boomkens, science information officer Climate & Energy - 06 3408 1461 / d.j.boomkens@tudelft.nl
• Floris den Broeder, science information Climate & Energy - 06 4520 7074 / f.denbroeder@tudelft.nl