It is September when the weather is still relatively warm, and the sun is shining bright. However, with the cold winter around the corner, amidst the Ukraine war and the energy crisis that Europe is about to face, it is unclear what the future has in store for us when it comes down to our energy supply and heating provisions.
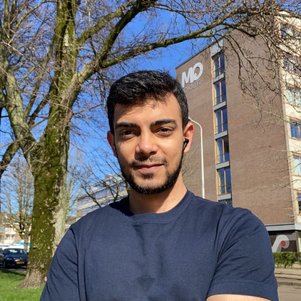
Master student Engineering and Policy Analysis (EPA), Sufiyan Mohammed, was given the opportunity to work on project "Energy Poverty"; a project related to one of the grand societal challenges and real-life problems in the Netherlands. Project "Energy Poverty" was approved by the Municipality of The Hague and Sufiyan worked on this with a group of EPA students as part of the course "Societal Challenges".
How did this project come to you?
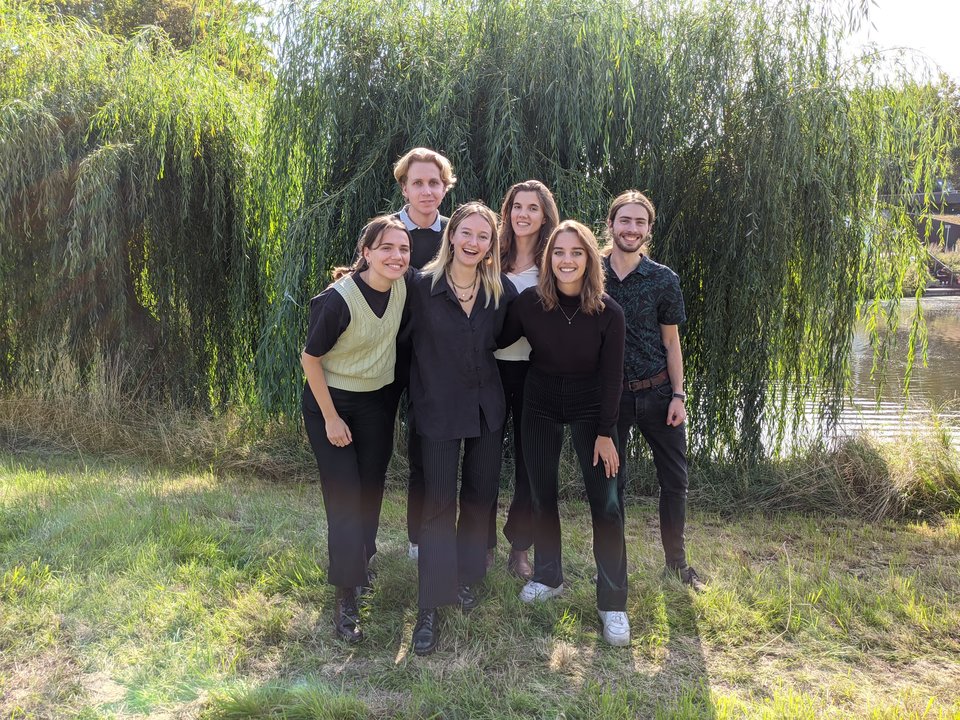
The Municipality of The Hague was looking to assess energy poverty in order to implement tailored policies for the required neighbourhoods within their Wijkagenda’s programme. The Municipality was very positive about the project that we initiated at EPA as project for the course “Societal Challenges”. The course offers to work on projects related to one of the grand societal challenges or real-life problems. As it was a large project, I worked on it with an incredible group of four other students.(*)
Why is this research necessary?
In September we started looking for a challenge to work on. We were still enjoying the warm summer weather but were also aware of the upcoming winter with all its challenges. The Ukraine war and the energy crisis made our lives very uncertain from all kinds of perspectives, but especially from an energy point of view. We saw this as an excellent opportunity to work on a subject of critical importance, to network and get consulting experience at the same time. Thus, we decided that energy poverty was going to be the challenge we would be working on. It was the need of the hour with the municipality also looking to assess energy poverty in order to implement tailored policies for the required neighbourhoods within their Wijkagenda’s programme.
What was your project question and how did you answer it?
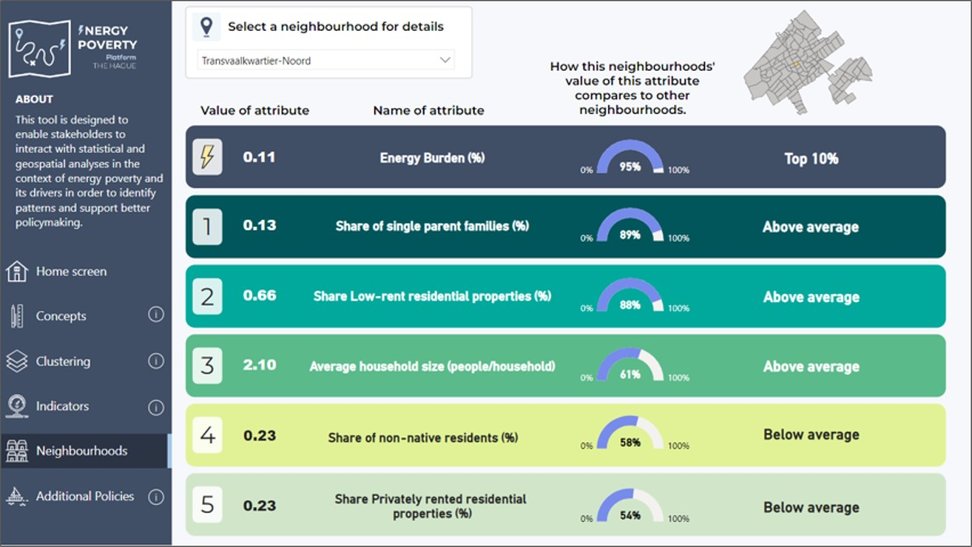
Before I answer that question, I would first like to explain what energy poverty means. All households have a certain energy burden; this is the amount of money a household spends on energy bills, namely electricity and gas, as a percentage of their monthly income. Once a household has no access to or cannot afford basic energy services, then they might be vulnerable to energy poverty. The question is: how do we measure this or which indicators do we need to measure to determine this? The risk of energy poverty and its consequences have become focal points of European debate on different levels. Governments have been increasingly targeting the reduction and mitigation of energy poverty in energy efficiency, decarbonisation, and clean energy policies to support a just energy transition for all. The Municipality of The Hague has also developed the “Help with high energy prices” page containing information on available support, the municipality’s measures being taken, and recommendations to save on energy costs. We developed a dashboard with the objective to deliver an EPA-related product to the municipality that is complementary and innovative to the already available tools they have. Therefore, the main objective of our product is to “enable actors and stakeholders to interact with statistical and geospatial analyses in the context of energy poverty and its drivers in order to identify patterns and support better policymaking”.
Can you tell us more about the fieldwork of the project?
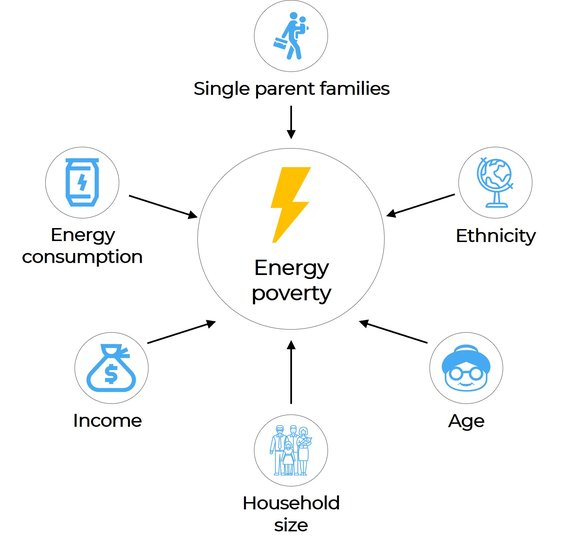
As Rittel & Webber once said, “when it comes to wicked problems, defining the problem is the problem”. Therefore, understanding the problem, framing it, and defining its causes and consequences was the initial yet most crucial step of the research. The problem of energy poverty is a complex problem that can be caused by numerous factors for example; age, income, household size, total energy consumption, ethnicity, number of parents in a household, unemployment, disabled personnel in the house etc. Often times, only an expenditure-based metric such as “energy burden”, is used as the primary measure expressed as the money spent on consumption relative to the average standardized income of a household. This causes problems as this generalises the different households solely based on their income and energy expenditure. It totally neglects the other important mentioned indicators perhaps due to the difficult data collection process. Our research involved collecting data from publicly available sources, at a neighbourhood level for 18 indicators that can determine to put a household at risk of energy poverty.
What were your primary objectives in this project?
The main objective of this project was to ensure that the dashboard being developed would have practical value. Given the critical nature and sensitivity of the situation at hand, our primary goal was to make a substantial impact through this research. Therefore, ensuring the utmost usefulness of the end-product was of paramount importance. Following our discussions with the Municipality, we made a collective decision to design the dashboard in a flexible manner, allowing it to serve not only as a tool for monitoring and visualizing energy poverty but also to be utilized by other departments within the Municipality.
Additionally, by adopting an open-ended approach to the dashboard's design, we aimed to maximize its potential and extend its utility beyond its initial purpose. This decision was made based on the recognition that the data and insights provided by the dashboard could be relevant and valuable for multiple areas of the Municipality's operations. This adaptability would enable other departments to leverage the dashboard's capabilities to address their specific needs and contribute to the overall effectiveness of the Municipality's current and future initiatives.
Our dashboard also serves as a gateway to a broader scope of research and projects within the same sphere. By including and linking other relevant projects and dashboards, we have created a platform that not only provides valuable insights but also facilitates access to a wealth of information for enhanced research. This integration elevates the dashboard's significance by offering users a comprehensive resource hub, increasing awareness of the problem not only for the municipality but also for future public users.
What exactly did you research?
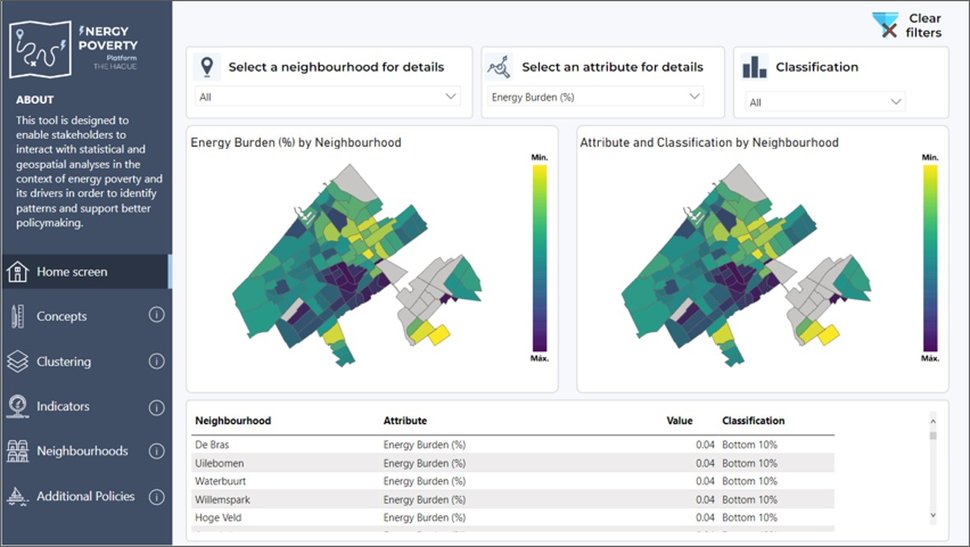
The research was a collective effort. It involved identification of definitions of energy poverty and the relevant factors associated. We spent endless hours on data collections that involved identification of indicators that were available for The Hague related to the factors engraved in scientific literature. The data analysis process involved data cleaning, data consolidation and calculations. Lastly, there was also the dashboard design to be considered that included custom geospatial visualisations.
Did you recognize topics from your Master course?
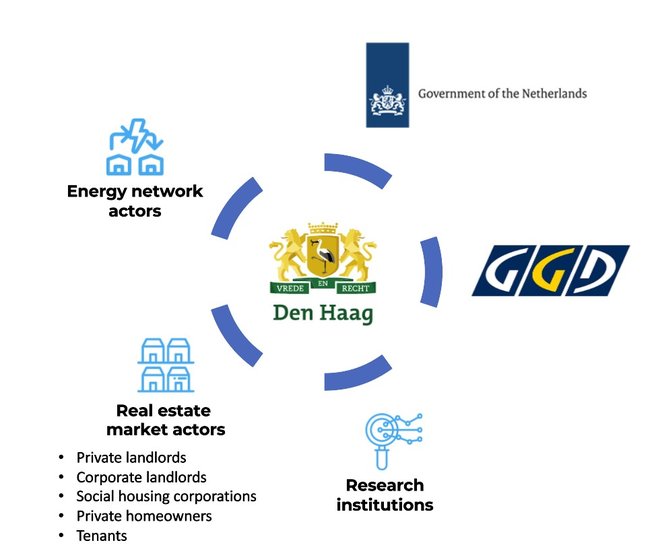
Absolutely! The initial phase of the project involved understanding the concept of energy poverty and how it affects and is understood by different stakeholders. At EPA we learn about System Analysis, which is a process that is taught in the course “PAMAS” (Policy Policy Analysis for Multi Actor Systems). PAMAS is the core of the EPA curriculum and is the very first course taught. It teaches us to look at things through a systems’ perspective, considering all the stakeholders and actors involved. Two tools that are part of the course are “means-end diagram” and “objective tree”. These two tools also happen to be the tools that helped us during this project to map out the main goals (objectives) of the actors in play (in this case the municipality) and how can that be achieved (means). The complete data collection, data analysis along with concepts of geo-spatial visualisation can also be credited to the courses taught in my Masters.
The dashboard we created can be used to identify and visualise different factors. These factors would show us whether a specific neighbourhood was at risk of energy poverty. The next step ideally would be the following; the Municipality can get crucial information about any of the 114 neighbourhoods within The Hague. This information would enable the Municipality to create specific tailored polices for these neighbourhoods. To advise the municipality with tailor-made policies is also something that is very well taught in our EPA curriculum. Perhaps this is a great basis for a future project for the next batch of EPA students.
How will the project proceed and what will happen to your input for the dashboard for Energy Poverty?
The Municipality of The Hague has complimented the efforts behind the dashboard and have requested immediate access to incorporate our dashboard in the research of their various departments. We are also invited to present the dashboard at City Hall for a larger audience. Perhaps our research was limited to our course, but we will always be there to help the municipality any way we can in the future.
What are your own plans?
This project provided an exceptional consulting experience centered around creating a meaningful impact. I firmly believe that the ultimate objective lies in effecting positive change and addressing pressing problems that require solutions, particularly the Grand Challenges faced by our world today. It is wonderful to be part of the MSc Engineering and Policy Analysis that lays the foundation for these challenges. I cannot wait to see what the future has in store for me.
(*) Project Energy poverty Dashboard is created by a group of EPA-students: Sufiyan Mohammed, Alexandre Curley, Jeroen Bouma, Christiaan Ouwehand en Adam Ignasse.

